FLOATSense logo

FLOATSense: A Time-Series Dataset and Benchmark for Fatigue Load Reconstruction on Floating Offshore Wind Turbine Towers

João Alves Ribeiro1, Bruno Alves Ribeiro2,3, Francisco Pimenta4, Sérgio M. O. Tavares5, Faez Ahmed1
1MIT   2TU Delft   3Brown University   4University of Porto   5University of Aveiro
Builds on FLOATBench    the same 19,404 simulations, sim_id and regime-aware partition, now as time series · FLOATBench page →

Does the model that wins at one sensor reconstruct the fatigue load along the whole tower?

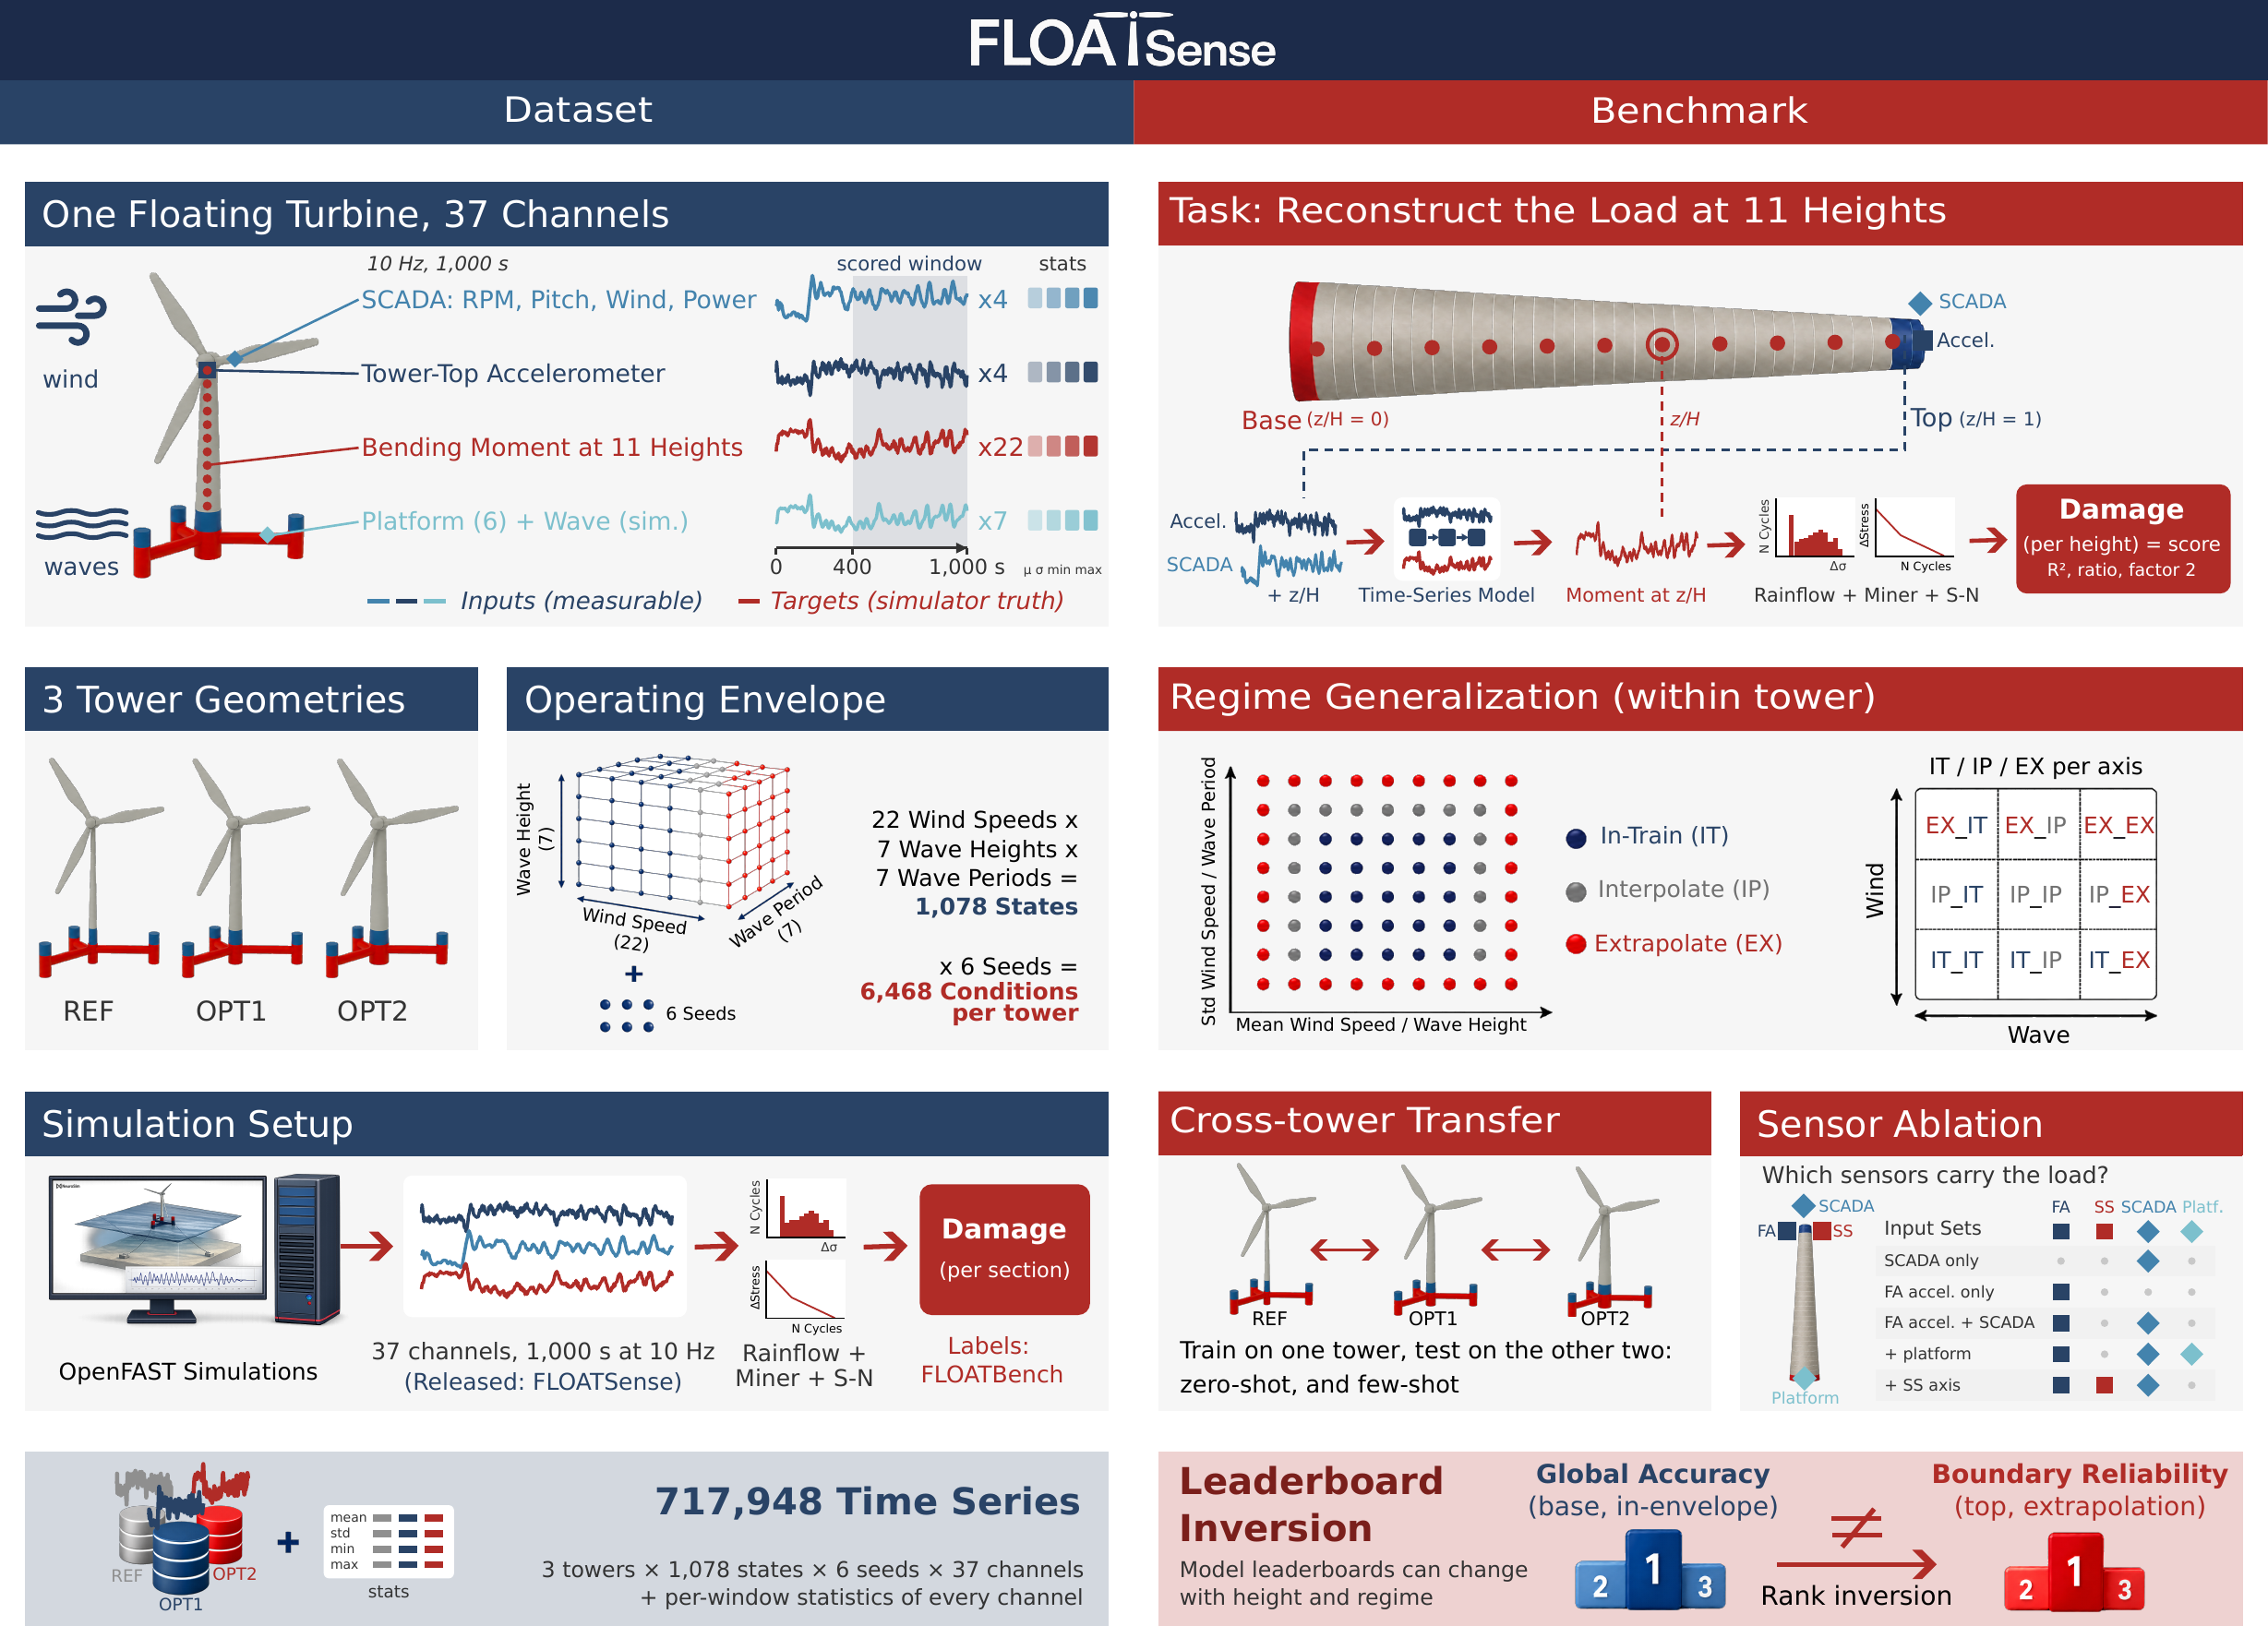
FLOATSense overview: dataset of three towers, task, damage-based scoring and benchmark protocols

Paper Highlights

718 k

time series at 10 Hz from 19,404 OpenFAST simulations

11 heights

fore-aft moment targets, scored by the fatigue damage they imply

3 of 20

learned models beat a one-gain floor at the top of the tower

5 sims

of a new tower recover its base, not its top

20 + 1

learned models in eight families and a field-validated physics baseline

Abstract

Fatigue limits the lifetime of an offshore wind turbine tower and is tracked from the bending moment along it, yet the strain gauges that measure it are rare and cover one section, while a tower-top accelerometer is standard. Reconstructing the moment at every height from that one sensor is a time-series problem, and no public benchmark scores it on the quantity engineers act on, the fatigue damage. We introduce FLOATSense, a dataset and benchmark for fatigue load reconstruction on 22 MW floating offshore wind turbines: 718 k time series at 10 Hz from the 19,404 OpenFAST simulations of FLOATBench on three tower geometries (37 channels, 1,078 operating points × six turbulence seeds per tower), with the accelerometer and SCADA signals as inputs and the fore-aft moment at eleven heights as target.

FLOATSense is distinguished by two choices: a reconstruction is scored by the fatigue damage it implies rather than by waveform error, and the six realizations of an operating point are kept together, so a model that reads only the condition scores zero on the within-condition metric. Twenty learned models and a field-validated physics baseline are evaluated within tower, across towers zero-shot and few-shot, and under sensor ablation.

Sensor-level leaderboards mislead: the base does not separate the models and its leaders collapse at the top, where at the declared budget only three learned models beat a one-gain floor; longer training recovers the top for the two TCNs, not for the attention and state-space models; five simulations of a new tower recover its base, not its top; and a second accelerometer axis improves the top at every budget. Limitations: the campaign is simulated, wind and waves are aligned, and only the fore-aft moment is scored. Data, code and leaderboard are released.

Dataset

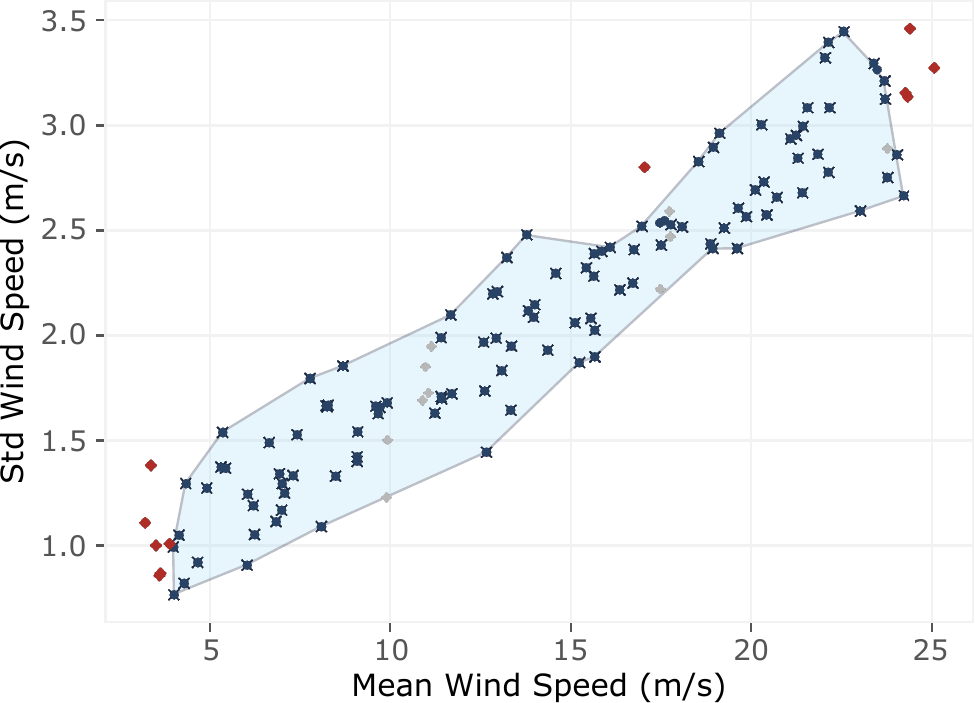
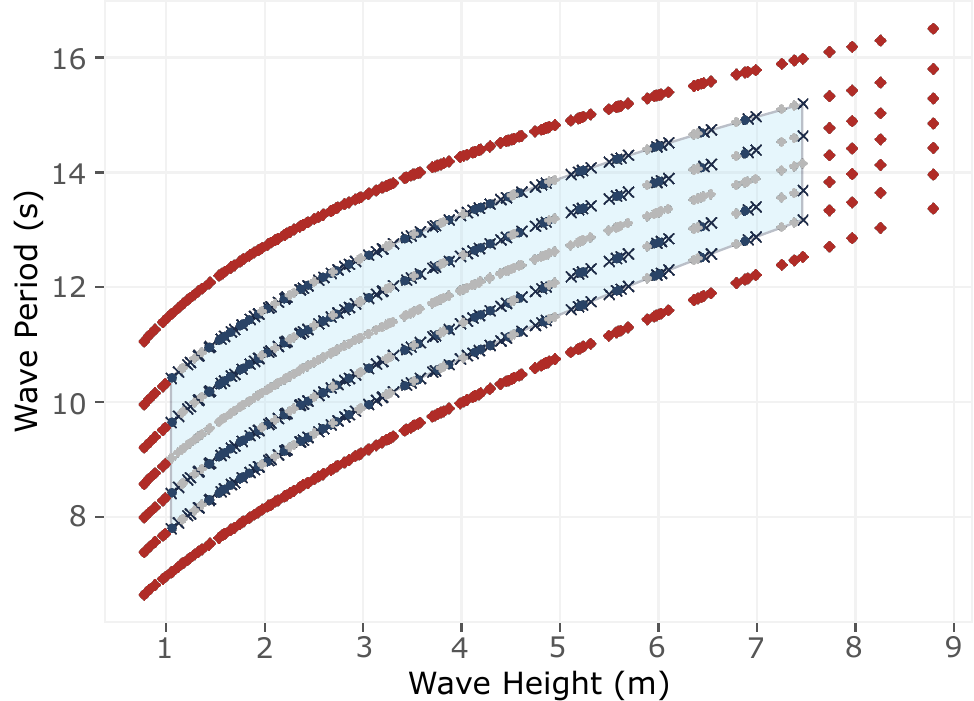
Operating envelope and simulation setup. The campaign of FLOATBench comprises 22 wind speeds and, at each, a 7 × 7 grid of 49 sea states in significant wave height Hs and peak period Tp, for 1,078 operating points. The IEA 22 MW turbine on a three-column semi-submersible is simulated with OpenFAST under IEC 61400-3-2 DLC 1.2, with aligned wind and waves. Each operating point has six realizations per tower, differing in the turbulence seed. A further 22 parked runs per tower, rotor parked and waves only, one at the median sea state of each wind speed, calibrate the physics baseline. Each run lasts 1,000 s at 10 Hz; evaluation uses the 400–1,000 s post-transient window (the scored window).

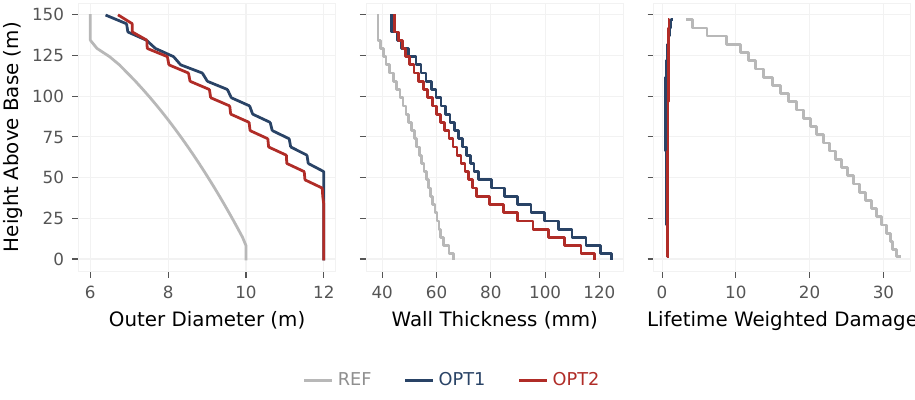
Tower geometries. The campaign is repeated on three towers of equal height sharing platform, controller and mooring, for 19,404 simulations: the IEA 22 MW baseline REF and the fatigue-aware redesigns OPT1 and OPT2 produced by FLOAT. REF is the flexible outlier (first fore-aft frequency 0.34 Hz against 0.57 and 0.54 Hz) and carries about 40 times the base lifetime damage of the two redesigns, so cross-tower shift comes at two levels.

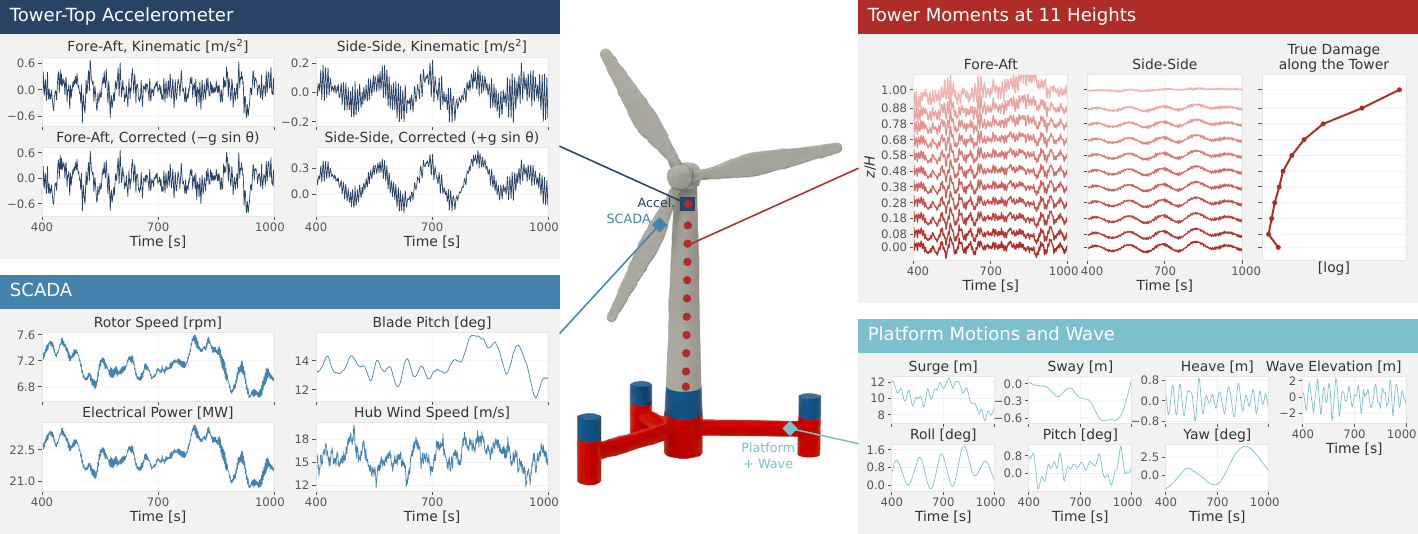
Channels. Each simulation is an array of 10,001 samples by 37 channels: tower-top accelerations, raw and gravity-corrected (×4), SCADA signals (×4), platform motions (×6), wave elevation (×1), and fore-aft and side-side moments at 11 heights (×22).

Damage scoring. True and reconstructed moments are low-passed at 3 Hz and pass through the damage model that generated the FLOATBench labels: rainflow counting, the DNV-RP-C203 S–N curve and Miner's rule, with the radius and wall thickness of the section. The simulation campaign required about 19,400 CPU-hours across the three towers.

The 37 channels of one simulation

The 37 released time series of one simulation (1,000 s at 10 Hz): tower-top accelerations and SCADA as inputs, platform motions and wave elevation as context, and the fore-aft and side-side moments at 11 heights as targets.

Outer diameter, wall thickness and lifetime damage of the three towers

Tower geometry and damage along the height of the three towers, from FLOATBench. Damage: lifetime-weighted Miner sum over all simulations.

Files (per tower, on Hugging Face)

FileRowsColumnsContent
series-<k>-of-00017.parquet64,686,46839sim_id, time_s and the 37 channels; 400 simulations per shard, one row group per simulation (10,001 rows)
series_stats.parquet6,468149Per simulation, mean, std, min and max of every channel over the scored window
metadata.parquet6,46814Operating point, realization, split, regime labels and lifetime weight, in FLOATBench order
sections.parquet117The 11 scored sections: FLOATBench section, height, radius, thickness, channel prefix, gauge height and z/H
damage.parquet71,1483Reference fore-aft damage at the 11 sections of every simulation
parked.parquet (shared)660,06631The 66 parked runs (22 per tower): 28 channels, waves only

8.0 GB per tower, 24.0 GB in all, CC-BY-4.0. Every file is keyed by the FLOATBench sim_id, the same on the three towers. The full dataset will be shared on Hugging Face; this page and its explorer use a preview subset of 141 simulations (47 per tower: one per wind speed, and all six realizations of five operating points).

Channels

GroupColumnOpenFASTUnitMeaning
Accelerationstower_top_afaYawBrTAxpm/s²Tower-top fore-aft acceleration
tower_top_afa_modYawBrTAxpModm/s²The same plus the gravity projection of the platform tilt: the task input
tower_top_assYawBrTAypm/s²Tower-top side-side acceleration
tower_top_ass_modYawBrTAypModm/s²The same plus the gravity projection of the platform roll
SCADArotor_speedRotSpeedrpmRotor speed (input)
blade_pitchBldPitch1degBlade pitch (input)
wind_speedWind1VelXm/sHub-height wind speed (input)
electrical_powerGenPwrkWGenerator power (released, not used)
Platform and waveplat_surge … plat_yawPtfmSurge … PtfmYawm, degSix platform motions
wave_elevWave1ElevmWave elevation at the platform
Targetstower_bottom_mfa, _mssTwrBsMyt, TwrBsMxtkN mBase moments (section 1)
tower_<k>_mfa, _mss, k = 1…9TwHt<k>MLyt, MLxtkN mMoments at gauge k (section 3k)
tower_top_mfa, _mssYawBrMyp, YawBrMxpkN mTower-top moments (section 30)

Terms used on this page

Height z/HGauge height as a fraction of the tower height H = 149.4 m. The 11 gauges run from the base (0) to the top (1); one model serves all of them with z/H as an input.
Scored window400 to 1,000 s of each 1,000 s run, after the start-up transient; every metric is computed on it.
RealizationOne of the six turbulence seeds of an operating point: the same U, Hs, Tp with a different random wind field.
Fatigue damage DFraction of the fatigue life consumed (Miner's rule) over the 600 s window. Summed over 25 years with damage_weight, D = 1 means the section reaches its fatigue limit.
R² of log damageCoefficient of determination of log10 D̂ against log10 D over the test simulations: the primary ranking metric. It can be negative when the damage level is wrong.
×2 · ratio · MREFraction of simulations within a factor of two of the true damage; median ratio D̂/D (1 = unbiased); mean relative error.
Within-condition corr.Correlation between true and reconstructed damage across the six realizations of each operating point. A model that only recognizes the condition scores zero.
RegimesThe FLOATBench label of each test simulation on the wind and on the wave axis: In-train (IT), Interpolate (IP) or Extrapolate (EX).
Floor · physicsThe floor is one scalar gain from the tower-top acceleration to the moment. The physics baseline is the field method of Pimenta et al. (2024), a six-constant spectral gain calibrated on the parked runs and the training split, extended to every height.

Dataset Explorer

One simulation per wind speed on each tower (the middle level of the wave grid, first realization), plus all six realizations at 5.5, 10.5, 14.5, 21.5 and 24.5 m/s: 47 simulations per tower, the same sim_id on the three towers, all in the test split. The model inputs on top; below, the fore-aft and side-side moments at the heights you pick (base dark red, top light). The scored window at 5 Hz. Pick the time window, the signals and the heights to show.

Preview subset   This page shows 141 of the 19,404 simulations, 47 per tower: for each of the 22 wind speeds the middle sea state of the wave grid (Hs and Tp level 4 of 7) with the first turbulence seed, and at 5.5, 10.5, 14.5, 21.5 and 24.5 m/s all six realizations. The full dataset will be shared on Hugging Face with the release.

Loading the time series…

Applies to both plots below; zooming in either plot also moves it.

Damage along the tower

True damage of the selected simulation (black) and the damage implied by each model's reconstruction, seed-0 checkpoints of the within-tower protocol. Dotted: the one-gain floor.

Load the Data

One simulation is one row group of one shard, so it is read without scanning the file. The benchmark code wraps this in floatsense.release.

# one simulation with pyarrow
import pyarrow.parquet as pq
import pandas as pd

meta = pd.read_parquet("opt2/metadata.parquet")
shard = pq.ParquetFile("opt2/series-00000-of-00017.parquet")
sim = shard.read_row_group(0).to_pandas()   # sim_id 1, 10,001 rows
# with the benchmark loader
from floatsense.release import load_tower

tower = load_tower("data/FLOATSense", "opt2")
x = tower.load(2377)             # (10001, 37) float32
test_ids = tower.split_ids("test")
damage = tower.damage()          # sim_id x section_id

Benchmark Protocol

Task

Given the gravity-corrected fore-aft tower-top acceleration, three SCADA channels (rotor speed, blade pitch and hub wind speed) and a requested height z/H, reconstruct the fore-aft bending-moment history at that height over the scored window, 400 to 1,000 s. One model serves the full tower with z/H as a constant input channel: training samples one of the 11 target heights per example, testing evaluates all 11 against the OpenFAST reference histories. Only the fore-aft moment is scored; side-side moments are released but not scored.

Regime-aware partition

The regime-aware partition of FLOATBench, with the same simulations on the three towers: 1,728 train (18 wind speeds, inner 4 × 4 sea states) and 4,740 test, with all six seeds of an operating point on the same side. Each test simulation carries its FLOATBench regime label on the wind and on the wave axis. Unlike field measurements, the simulations give the true moment at every height and in extreme conditions, so extrapolation can be checked. The grid counts test simulations per cell (the same for every tower).

Regime partition in the wind plane
Regime partition in the wave plane
Legend of the regime partition

FLOATBench regime partition in the wind (left) and wave (right) planes.

Evaluation protocols

Within tower

Train and test on the same tower, on the regime-aware partition. Results along the 11 heights and per regime cell; the within-condition correlation tests whether a model tracks the realization or only the condition.

Cross tower

A model trained on one tower applied to each of the other two (six pairs). Zero-shot, and ten-shot: 100 adaptation steps on ten simulations of the target training split. The towers share the wind and wave realizations, so only the tower design changes.

Sensor ablation

Every simulation records all 37 channels, so other installations are compared on the same runs: the accelerometer alone, SCADA alone, both accelerometer axes, or the six platform motions added.

Models. Twenty learned models in eight families (convolutional, recurrent, attention, state-space, spectral, period-folding, pretrained encoders with a trained head and physics-anchored), among them a Prob-TCN with a heteroscedastic head, a condition-dependent spectral gain, and a hybrid that learns a bounded correction of the physics gain. The floor is one scalar gain from the tower-top acceleration to the moment. The physics baseline is the field method of Pimenta et al. (2024), extended to every height with a height factor.

Training. One recipe for every model, declared in advance: 50 epochs of Adam at 10−3, batch 16, mean squared error on the standardized moment, no weight decay, scheduler or early stopping, the last epoch scored. Seed 0 everywhere, three training seeds for the thirteen models within tower. Longer budgets (150 and 300 epochs) are probes on selected models.

Metrics. R2 of log10 damage (primary), median ratio, MRE, fraction within a factor of two, and within-condition correlation, with 95% bootstrap intervals that resample operating points (B = 1,000). A pairwise difference counts when the paired interval excludes zero on all three towers.

Leaderboard

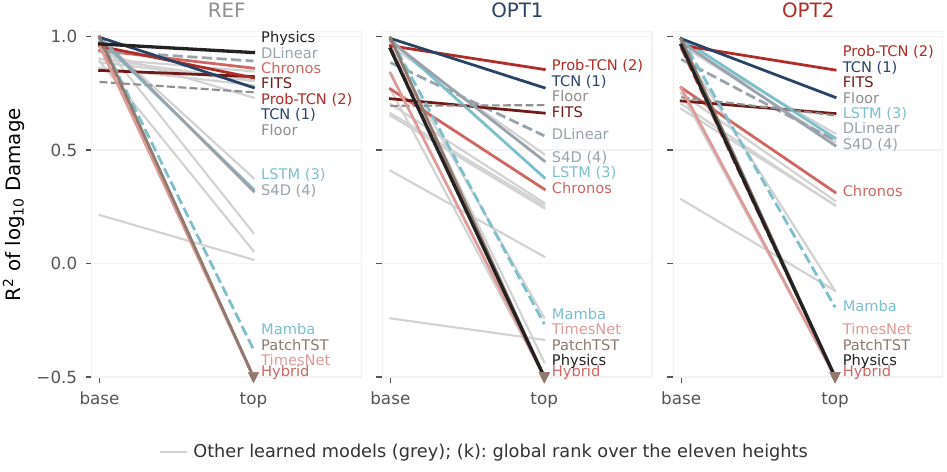
All 20 learned models, the physics baseline and the floor at the declared budget of 50 epochs, scored by the fatigue damage of the reconstruction. From the base to the middle of the tower the ranking barely moves; switch to gauge 8 and the top to see it change. Each cell is the median over three seeds where they exist, else seed 0 (†). Click a row to follow that model in the plots.

R² of log10 damage along the tower for the selected model, the top three at this height, the physics and the floor; clipped at −1.

Rank at the base against rank at the chosen height. On the diagonal a model keeps its base rank; above it, the model ranks worse here than at the base.

Point estimates on the test split; bootstrap intervals and the 150 and 300 epoch probes are in the paper and produced by scripts/benchmark/. Zero-shot: mean over the six source–target pairs or one pair; the physics is recalibrated on the target and is not listed there.

Results

Within tower · along the height

The base does not separate the models, the top does

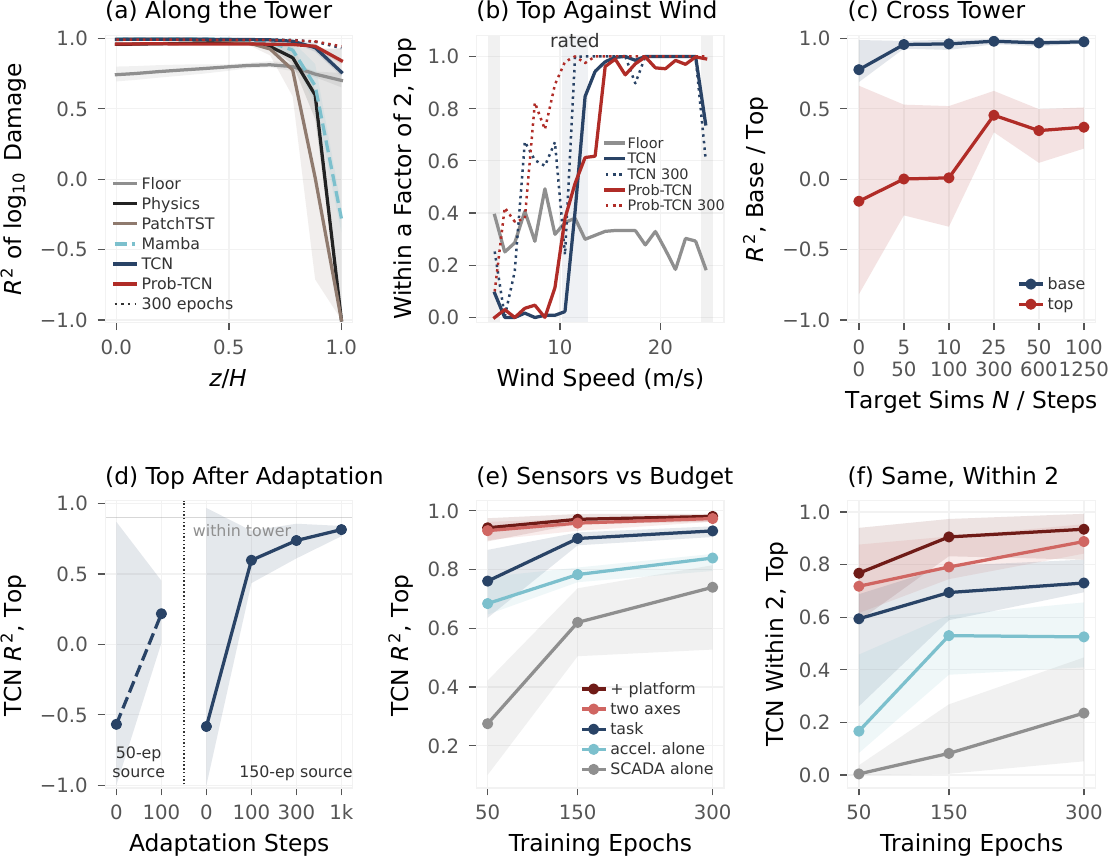
At the base the sequence models are indistinguishable, and all beat the physics. Ten of the 22 entries reach R2 ≥ 0.95 at the base and the first seven lie within 0.023: Mamba, PatchTST and TCN score 0.99 to 1.00, the physics 0.967 / 0.944 / 0.961 and the floor 0.742 on average.

The top spreads the entries from −2.3 to 0.84, and the base ranking does not predict it. The rank correlation between base and top is −0.37 / 0.04 / 0.22. PatchTST and Mamba, first at the base, fall below zero at the top with no simulation within a factor of two; TCN keeps 0.775 / 0.774 / 0.732 and Prob-TCN 0.818 / 0.855 / 0.852. Only three learned models beat the floor at the top (0.70): Prob-TCN, TCN and FITS.

Main results of the paper

(a) R² along the tower; (b) top within a factor of two against wind speed; (c, d) cross tower; (e, f) sensor sets against the training budget.

A leaderboard at the base of the tower does not tell which model reconstructs its top.

Within tower · why the top fails

Training and variance, not missing information

TCN and Prob-TCN are under-trained at the top; the models that collapse stay collapsed. At 300 epochs TCN reaches 0.923 / 0.935 / 0.935 at the top and Prob-TCN 0.924 / 0.953 / 0.953, level with the physics on REF. S4D stays at 0.61 to 0.65 and PatchTST below zero. Trained for the top alone, TCN scores 0.90 / 0.94 / 0.93 and Prob-TCN 0.97 / 0.98 / 0.98, while PatchTST, S4D and Mamba still fail; a damage-aware loss rescues S4D (0.88 to 0.94).

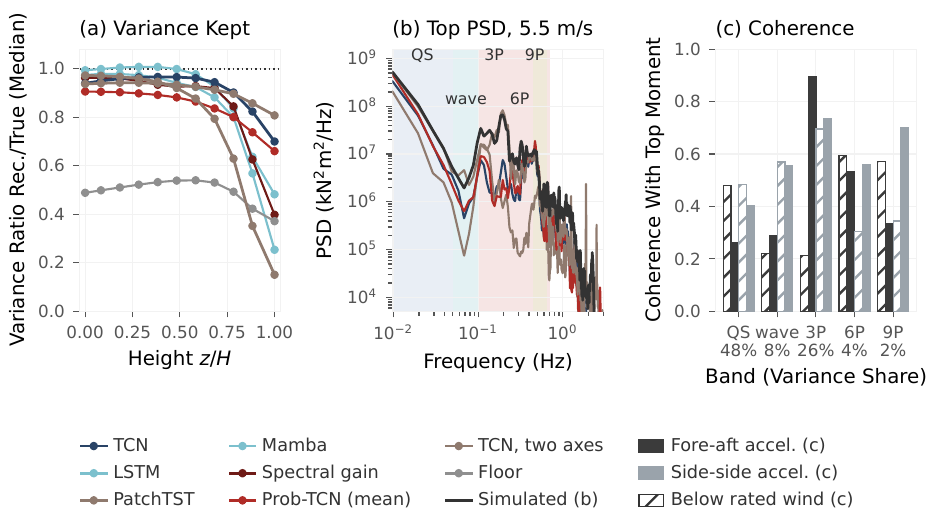
The all-height TCN keeps 0.63 to 0.73 of the true variance at the top; restoring it with noise lifts the score, not the within-condition correlation.

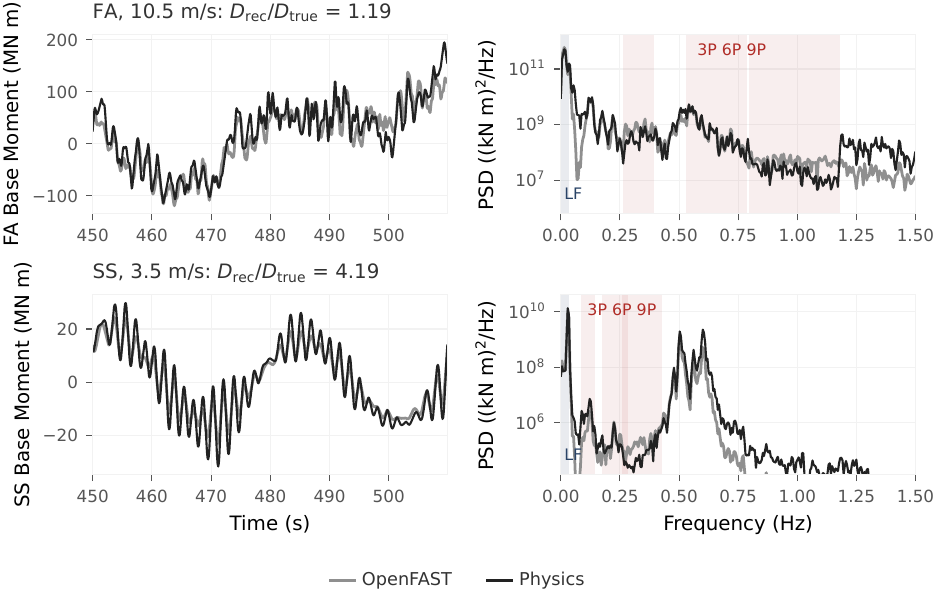
Why the top fails

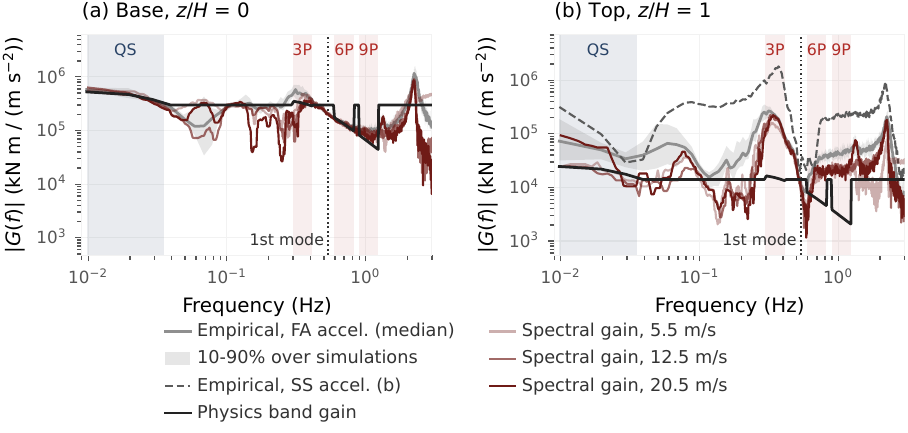
Why the top fails, OPT2: variance ratio along the tower, spectra and coherence of the top moment.

At the declared budget a top score measures convergence as much as architecture; the collapse of the attention and state-space models survives a longer budget.

Within tower · by regime

At the top, low wind is the hard condition

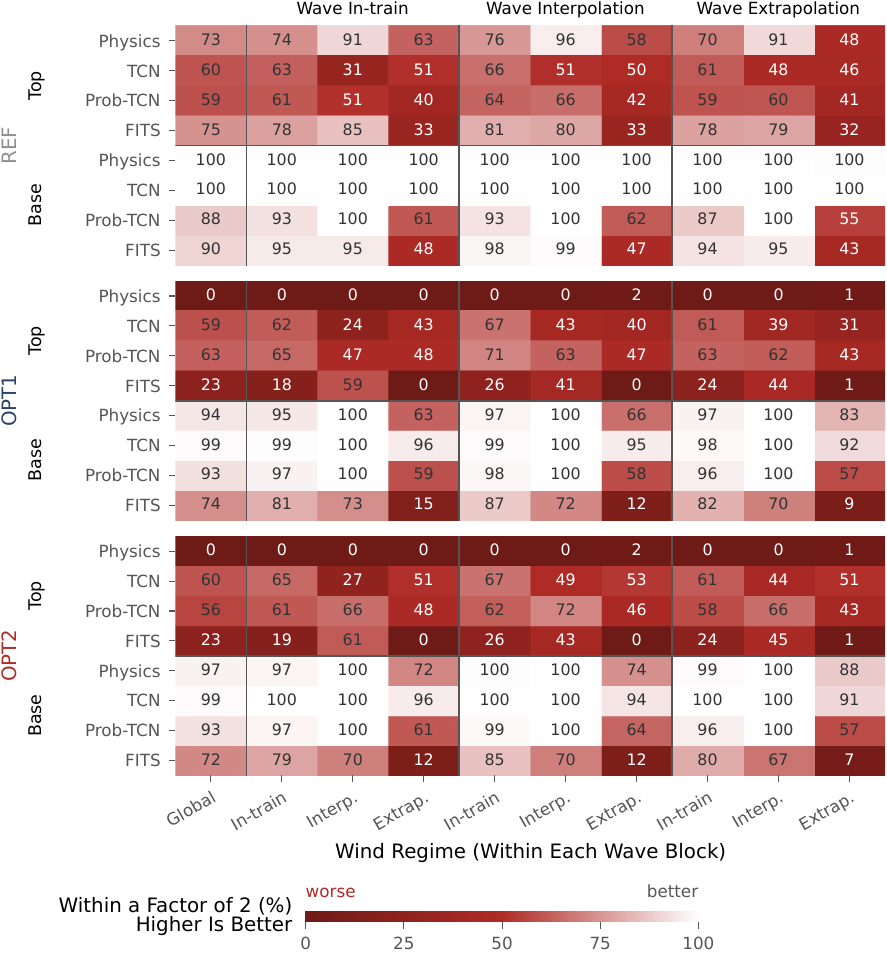
Waves never cost. Wave extrapolation moves the fraction within a factor of two by −10 to +9 points for every model at any height. At the base, on extrapolated wind, the physics falls to 73 to 80% on the redesigns and Prob-TCN to 58 to 60%, while PatchTST and Mamba stay at 100%.

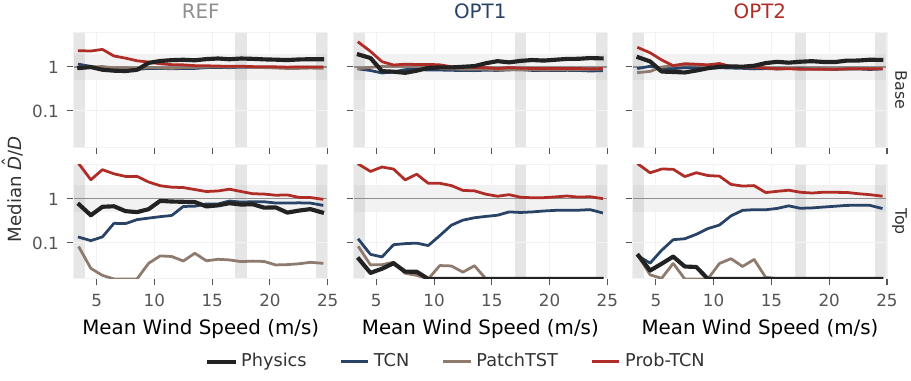
At the top the axis that matters is wind speed, not the regime label. TCN is within a factor of two on 0 to 12% of simulations below 10 m/s, in train or not, and on 92 to 99% above 13.5 m/s. Winds below 10 m/s carry only 3 to 5% of the lifetime top damage.

Median damage ratio per wind speed

Median damage ratio per mean wind speed at the base (top row) and at the top (bottom row); gray band: factor-two range.

At the top, what decides the error is the wind speed, not the regime label.

Cross tower · zero-shot and few-shot

Zero-shot keeps the ranking, five simulations recover the base, not the top

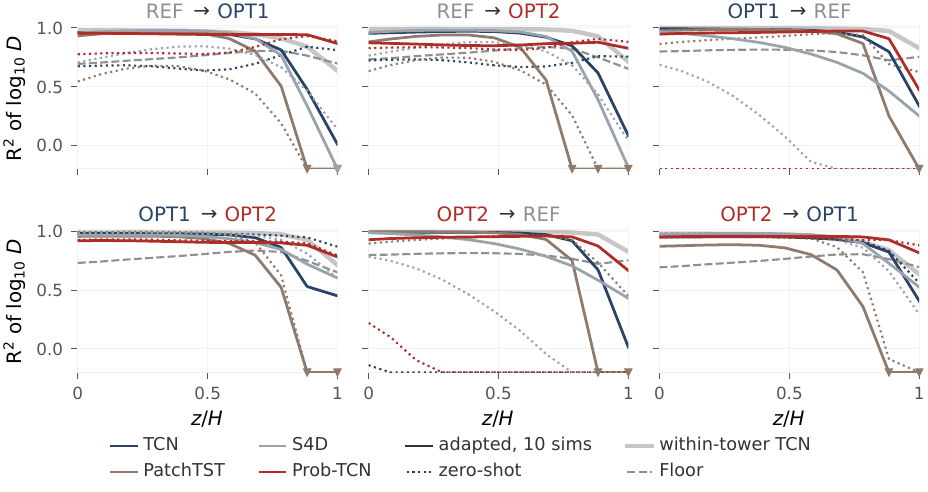
Zero-shot fails on scale, not on ranking. The median zero-shot R2 at the base is 0.93 and 0.84 between the redesigns, 0.75 and 0.71 into REF, where the models over-predict (median ratio 2.6 and 2.5), and 0.41 and 0.48 out of it; the within-condition correlation stays at 0.84 to 0.95, so the realizations are ranked right and placed at the wrong level.

Five target simulations recover the base; no adaptation measured recovers the top. With five target simulations LSTM, Mamba, S4D, TCN and PatchTST score 0.89 to 1.00 at the base on every pair. At the top, after ten-shot adaptation, Prob-TCN averages 0.71, the floor 0.56 and TCN 0.44.

Adaptation along the tower

R² along the height, zero-shot (dotted) and after ten-shot adaptation (solid), one panel per ordered pair.

Five simulations of a new tower are enough at its base; no adaptation measured recovers its top.

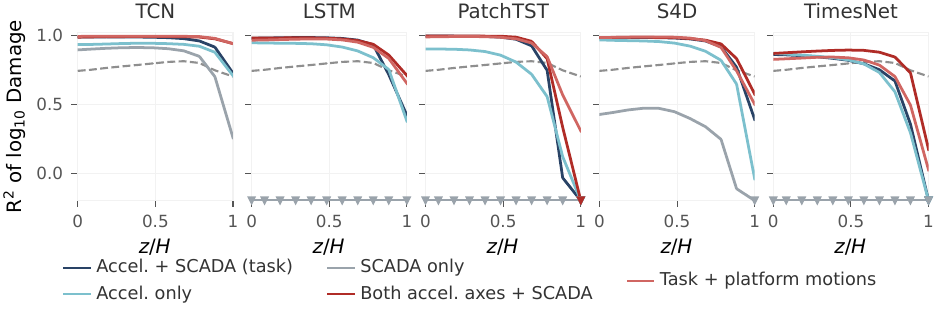
Sensor ablation

The second accelerometer axis helps the top at every budget

At the top, TCN scores 0.94 with the platform motions added, 0.93 with both accelerometer axes, 0.76 with the task inputs, 0.68 with the accelerometer alone and 0.28 with SCADA alone; at 300 epochs 0.98, 0.97, 0.93, 0.84 and 0.74. The R2 gain of the second axis shrinks from 0.17 to 0.04, but at 300 epochs it still brings 87 to 90% of simulations within a factor of two against 72 to 76% with the task inputs, and within-condition correlation 0.94 to 0.95 against 0.82 to 0.88.

Sensor ablation along the tower

R² along the height under the five input sets, one panel per model, mean over the three towers.

The accelerometer is the sensor: with enough training one fore-aft axis gets the level of the top damage, and a second axis brings its fatigue metrics close to the base.

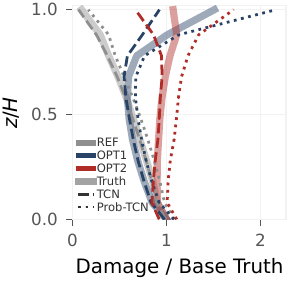
Lifetime damage

The top governs the redesigns, and it is where reconstruction fails

On the redesigns the top carries at least as much lifetime damage as the base (1.5 times on OPT1, 1.07 times on OPT2), so the height where every model struggles is the one that governs their fatigue life. At the base the sequence models reconstruct the lifetime damage within about 20%, and the physics is 10 to 44% conservative. At the top TCN reconstructs 0.61 to 0.66 of it and Prob-TCN 1.44 to 1.74, still 0.67 to 0.76 and 1.15 to 1.26 at 300 epochs.

Lifetime damage along the tower

Lifetime damage along the tower over the base truth of each tower.

More Results from the Paper

Figures from the appendix of the paper. Click a figure to open it at full size.

Scope and Future Work

Simulation only. No measured load series enters the benchmark; the calibrated physics constants give a plausible platform pitch period, a plausibility check, not a validation. A leaderboard winner has still to survive sensor noise, sampling jitter and unmodeled dynamics.

One turbine family, aligned seas. All simulations are of one 22 MW turbine on one platform under DLC 1.2, so cross tower measures a change of tower design, not of turbine class or load case; the aligned waves leave side-side without direct wave excitation, which is why the side-side moment is released but not scored.

Mid-fidelity simulation. OpenFAST models the tower as a beam with engineering aerodynamics and hydrodynamics; higher-fidelity (FEA, CFD) re-runs of selected conditions will be released as new versions.

One recipe, short of convergence. All models share one budget of 50 epochs, equal and declared in advance, which is not converged at the top: every top number is a number at this budget, and the longer probes cover four models at 300 epochs.

Resources

 FLOATSense (code)

Loader, damage scorer, physics baseline, the 20 learned models, evaluation harness and the scripts behind every table and figure, driven by --flagfile configs. MIT license.

 FLOATSense (dataset)

The 19,404 simulations of the three towers in Parquet, with metadata, sections, reference damage and the 66 parked runs. 24.0 GB, CC-BY-4.0. Coming soon on Hugging Face.

 FLOATBench

The simulation campaign FLOATSense builds on: the same simulations, identifiers and regime-aware partition, with 582,120 tabular fatigue labels and their benchmark.

 FLOAT (design framework)

The fatigue-aware tower design framework that produced the OPT1 and OPT2 geometries; the towers are released as OpenFAST models.

Citation

@misc{ribeiro2026floatsense,
      title={FLOATSense: A Time-Series Dataset and Benchmark for Fatigue Load Reconstruction on Floating Offshore Wind Turbine Towers},
      author={João Alves Ribeiro and Bruno Alves Ribeiro and Francisco Pimenta and Sérgio M. O. Tavares and Faez Ahmed},
      year={2026},
}

Acknowledgements

The simulations underlying FLOATSense were produced with OpenFAST on the IEA-22-280-RWT reference floating wind turbine. The physics baseline follows the load reconstruction method of Pimenta et al. (2024). We thank these communities for keeping the underlying tools open.