FLOATBench logo

FLOATBench: A Tabular Dataset and Benchmark for Fatigue Prediction on Floating Offshore Wind Turbine Towers

João Alves Ribeiro1, Bruno Alves Ribeiro2,3, Francisco Pimenta4, Sérgio M. O. Tavares5, Faez Ahmed1
1MIT   2TU Delft   3Brown University   4University of Porto   5University of Aveiro
Dataset on Hugging Face    load it with one line: load_dataset("DeCoDELab/FLOATBench", "ref") · Open on HF →

Does model selection stay valid as predictions move from interpolation to extrapolation?

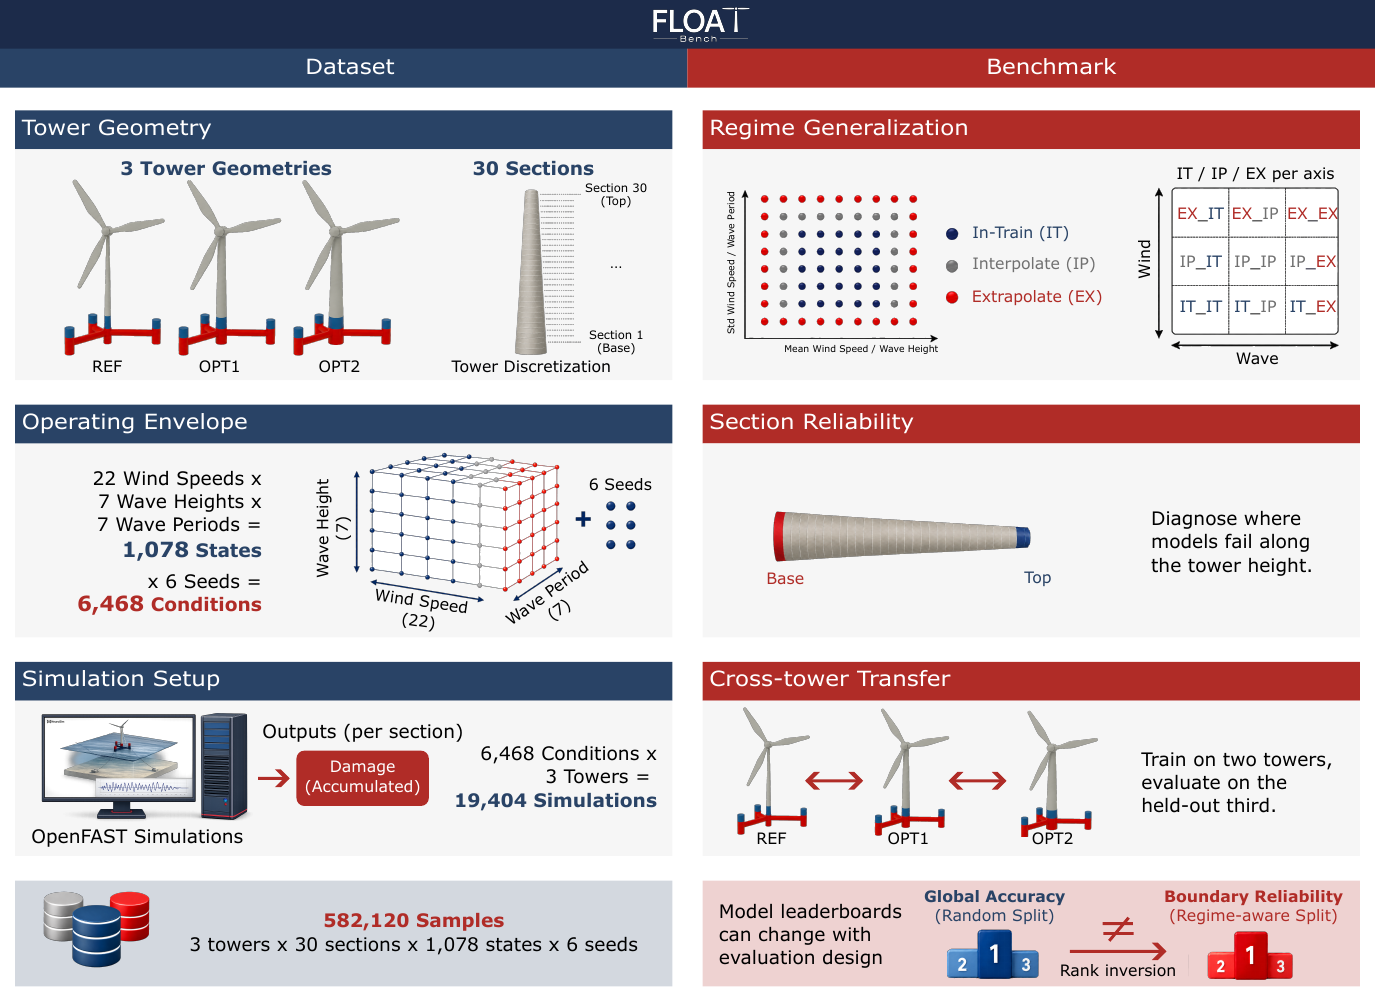
FLOATBench overview: dataset of three towers, regime-aware split, benchmark protocols

Paper Highlights

582,120

per-section fatigue-damage labels from 19,404 OpenFAST simulations

3 towers

22 MW geometries over 1,078 wind–wave operating conditions

1 → 23

the global rank-1 model in joint wind-and-wave extrapolation

1.5–1.9×

the best extrapolation error left by validation-based selection

735

trained surrogates and 7 standalone baselines released

Abstract

Tabular surrogates are commonly ranked on random validation splits. Yet a surrogate is used to predict wherever no simulation exists, both between training points (interpolation) and beyond the training domain (extrapolation), and random splits cannot tell the two apart, so the selected model may fail where it extrapolates. We introduce FLOATBench, a tabular dataset and benchmark for fatigue prediction on floating offshore wind turbine towers that tests whether model selection stays valid as predictions move from interpolation to extrapolation. It provides 582,120 per-section fatigue-damage labels from 19,404 OpenFAST simulations of three 22 MW tower geometries over 1,078 wind–wave operating conditions.

FLOATBench is distinguished by a regime-aware partition that places each test point relative to the training domain as in-train, interpolation, or extrapolation, so extrapolation depth is controlled by construction, and by cross-tower transfer with condition-level bootstrap intervals. Across 735 trained surrogates and seven standalone baselines on three towers, the global rank-1 model falls to ranks 23, 11, and 11 in joint wind-and-wave extrapolation, where a network ranked 69th–79th globally wins, and validation-based selection leaves 1.5–1.9× the best available extrapolation error. In cross-tower transfer, Rel L² error is 0.067–0.098 when the reference tower is in training versus 0.423 when it is held out.

Robustness checks show that the crossover holds across all non-degenerate partition settings and after retraining on two alternative training grids. Limitations: one 22 MW design family and aligned power-production conditions. Resources: dataset, code, and trained surrogates are released.

Dataset

Operating envelope. Each tower is simulated across a 22 × 7 × 7 grid of environmental conditions: 22 mean hub-height wind speeds at the midpoints of 1 m/s bins from cut-in (3 m/s) to cut-out (25 m/s), and, for each wind speed, seven significant wave heights Hs with seven peak periods Tp per Hs, sampled from the joint wind–wave operating distribution used in FLOAT. This yields 49 sea states per wind speed and 1,078 unique (wind, wave) operating points per tower. Wind and waves are aligned.

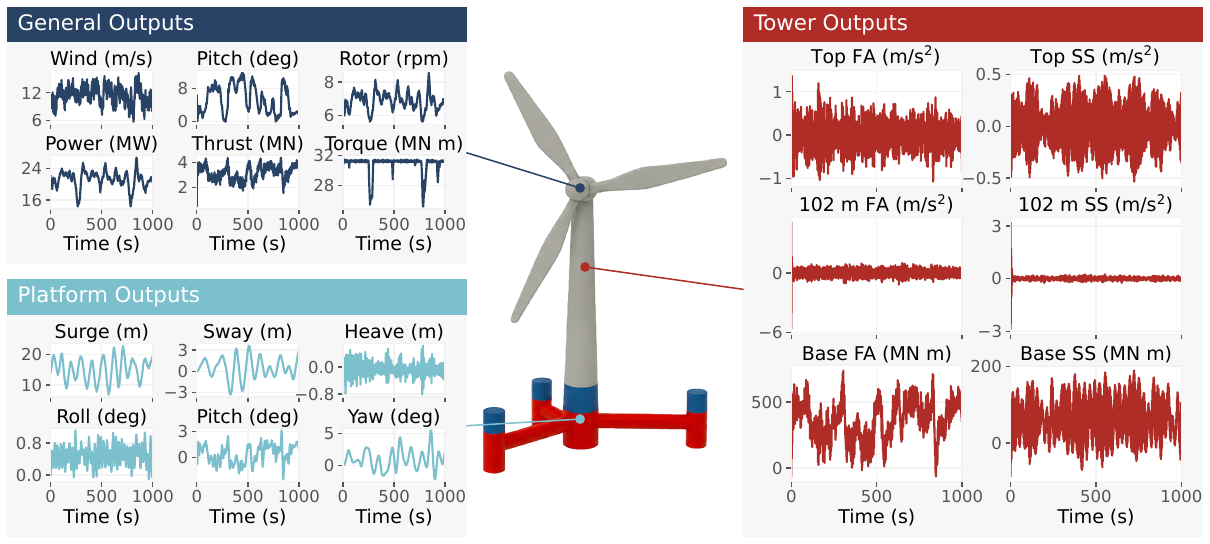
Simulation setup. All simulations follow IEC 61400-3-2 design load case (DLC) 1.2 (normal power production) and run in OpenFAST. Each operating point is simulated with 6 independent turbulence seeds, giving 6,468 ten-minute simulations per tower; runs last 1,000 s with the final 600 s post-processed. Each run records 88 time series at 10 Hz (turbine, tower and platform outputs), about 190 GB across the 19,404 runs of the three towers, at roughly one CPU-hour per run.

Damage labels. For each operating condition and each of the 30 tower sections, the bending-moment time series is converted to stress, rainflow-counted and Miner-summed against the DNV-RP-C203 S–N curve E, giving the cumulative damage D, the released label. The load-equivalent transform DEL ∝ D1/m with m = 3 is used as the regression target.

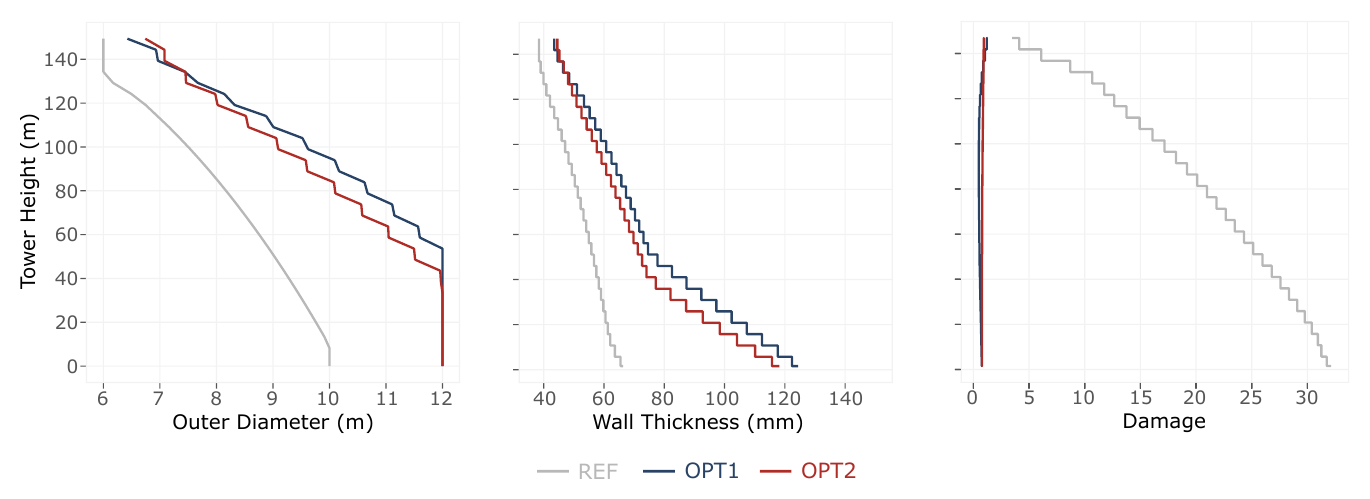
Tower geometries. Three towers share the same three-column semi-submersible platform, controller and mooring. REF is the IEA-22-280-RWT baseline tower, designed for fixed-bottom conditions without explicit fatigue constraints (D ≈ 32 at the base, about 9 months of life under Miner's rule on a 25-year horizon). OPT1 is an intermediate fatigue-aware redesign produced by FLOAT (D from 0.49 to 1.28 along the height), and OPT2 the final iterate targeting D ≤ 0.90 (labels from 0.78 to 0.94). The redesigns change the outer diameter and wall thickness at constant tower height (149.386 m). Each tower is discretised into 30 sections, with damage labels at the section midpoints: 194,040 rows per tower and 582,120 in total.

OpenFAST outputs and damage pipeline

FLOATBench OpenFAST outputs and damage pipeline. Each simulation yields 88 time series at 10 Hz around the IEA-22-280-RWT on a three-column semi-submersible: simulations → time series → bending moments → stress → rainflow → S–N + Miner → damage labels.

Outer diameter, wall thickness and lifetime damage of the three towers

Geometry and lifetime damage profiles along the tower height for the three released towers REF, OPT1 and OPT2.
Files (per tower, on Hugging Face)

FileRowsColumnsContent
train_damage.csv51,84018288 training conditions × 6 seeds × 30 sections, all In-train
test_damage.csv142,20018790 test conditions × 6 seeds × 30 sections, with regime labels
data.csv194,04016All simulations without split or regime labels
metadata.jsonCounts and split summary

Columns

GroupColumnMeaning
Identifierssim_idSimulation identifier; ties together the 30 sections of one run
section_idTower section, 1 (base) to 30 (top)
wind_speed_idWind-speed grid index, 1 to 22
wave_hs_idWave-height grid index, 1 to 7
wave_tp_idPeak-period grid index, 1 to 7
wind_seed_idTurbulence seed, 1 to 6
Inputs: wind and waveswind_speedNominal hub-height wind speed (m/s)
mean_wind_speedRealised 10-min mean hub-height wind speed (m/s)
std_wind_speedRealised 10-min standard deviation of hub-height wind speed (m/s)
wave_hsSignificant wave height (m)
wave_tpWave peak period (s)
Inputs: tower sectionsection_height_mSection midpoint height along the tower (m)
section_radius_mSection outer radius (m)
section_thickness_mSection wall thickness (m)
Regime labelswind_groupIn-train Interpolate Extrapolate in the wind plane
wave_groupThe same labels in the wave plane
TargetsdamageMiner-summed fatigue damage of the section in one 600 s simulation (dimensionless)
damage_weightExpected number of 600 s windows the simulation represents over the 25-year life (occurrence probability × 1,314,000). Lifetime damage of a section = Σ damage × damage_weight

Terms used on this page

Wind speed VMean wind speed at hub height, in m/s. The 22 levels are the midpoints of 1 m/s bins between cut-in (3 m/s) and cut-out (25 m/s): 3.5, 4.5, …, 24.5 m/s. Its standard deviation over the 10 minutes is used as a proxy of turbulence intensity.
Wave height HsSignificant wave height, in m: roughly the average height of the highest third of the waves. It measures how rough the sea is.
Wave period TpPeak wave period, in s: the period of the waves that carry the most energy. Long periods mean long swell, short periods a choppy sea.
Turbulence seedOne random realisation of turbulent wind for the same mean conditions. Each condition is simulated with 6 seeds, so the same V, Hs, Tp gives 6 slightly different results.
Tower sectionOne of the 30 slices of the tower where fatigue is evaluated: section 1 is the base, section 30 the top.
Fatigue damage DFraction of the fatigue life consumed (Miner's rule). Per simulation it is the damage of 600 s; summed over 25 years with damage_weight, D = 1 means the section reaches its fatigue limit.
DELDamage equivalent load: the constant-amplitude load that would cause the same damage, DEL ∝ D1/3. Surrogates are trained and scored on this target.
Rel L² DELRelative L² error of the predicted DEL, ‖prediction − truth‖ / ‖truth‖ over the test rows: the primary ranking metric (0.05 is about 5% error; lower is better). MRE, the point-wise mean relative error, is the per-regime metric.
RegimesWhere a test point lies relative to the training data, labelled separately for wind and for waves: In-train (IT) close to training points, Interpolate (IP) inside the training region but between points, Extrapolate (EX) outside it. A cell such as EX_IT reads wind label first, wave label second; EX_EX is extrapolation in both wind and waves, the hardest case.
E1 / E2 / E3The three protocols: random split (E1), regime-aware split within one tower (E2), and training on two towers and testing on the third (E3).

Dataset Explorer

All 6,468 simulations of the operating envelope, read directly from the Hugging Face dataset DeCoDELab/FLOATBench when this page opens. Pick a view, colour the points by regime or by damage, and click any simulation to see its damage along the selected tower, or switch to the 25-year lifetime damage.

Loading the dataset from Hugging Face (DeCoDELab/FLOATBench)…

One point = one 600 s simulation. Drag to rotate, click to select.

Damage per section of the selected tower (log scale); dotted line = slider section. D = 1 is the fatigue limit.

Live Rows from Hugging Face

Read directly from DeCoDELab/FLOATBench through the Hugging Face dataset viewer API. Every row is one tower section of one simulation.

rows 1–20

Loading rows…

# load one tower on the fly
from datasets import load_dataset
ds = load_dataset("DeCoDELab/FLOATBench", "ref")
print(ds)  # train: 51,840 rows, test: 142,200 rows
# or download the CSVs once
hf download DeCoDELab/FLOATBench \
    --repo-type=dataset --local-dir=data

Benchmark Protocol

Regime-aware partition

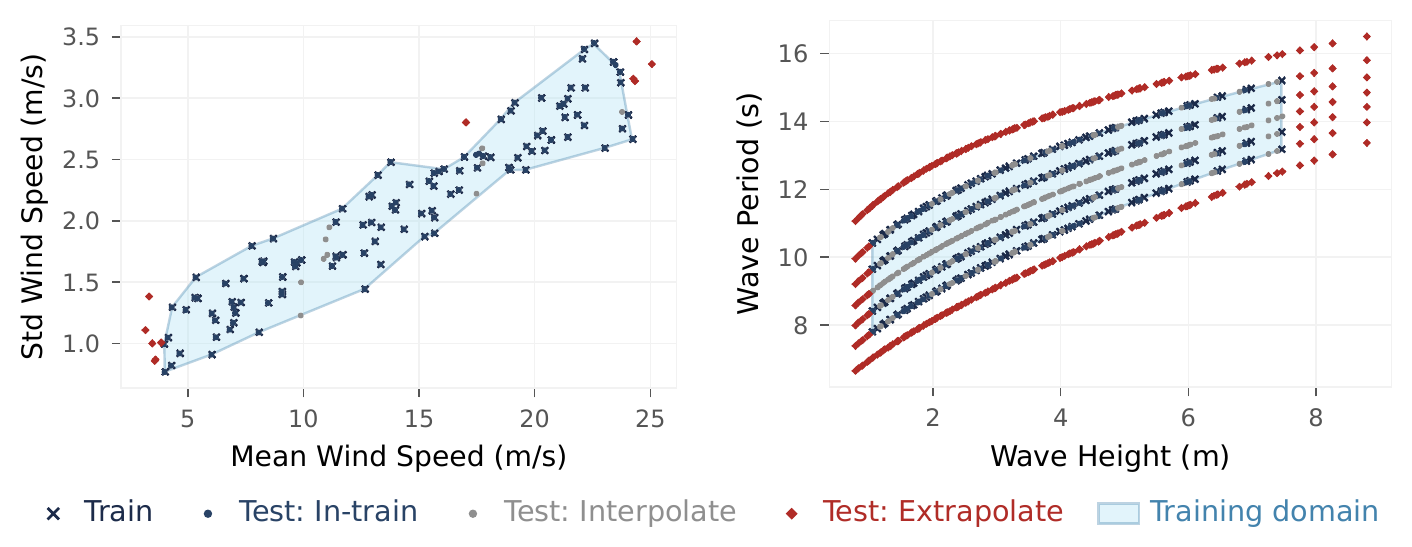
Train/test split. From the 22 × 7 × 7 grid, test holds the extreme and middle indices on both the wind and wave axes, leaving 18 of 22 wind speeds and a 4 × 4 inner wave patch on the train side. All 6 seeds of a condition stay in the same fold, to prevent train–test leakage. This yields 51,840 train and 142,200 test rows per tower (about 27/73). Unlike an i.i.d. 80/20 split, the partition induces a structured covariate shift along both axes: the test set is larger than the training set and lies outside its support, so every extrapolation region is densely sampled.

Regime labelling. Each test point is labelled In-train, Interpolation or Extrapolation (IT, IP, EX) independently in the wind (mean V, std V) and wave (Hs, Tp) subspaces:

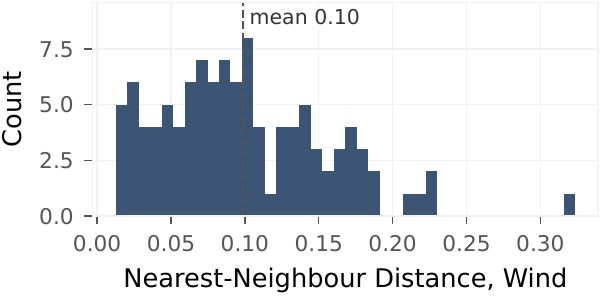
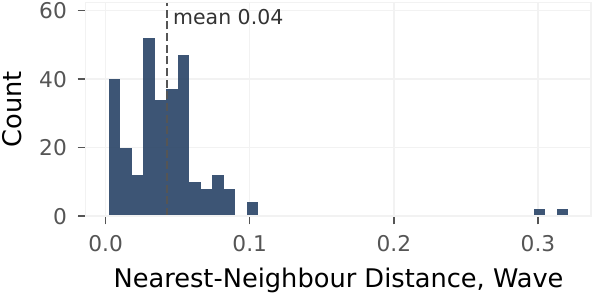
  1. Train spacing. The mean nearest-neighbour distance between training points, in standardised units, sets the spacing scale.
  2. Distance-based grouping. A test point whose nearest-training distance, normalised by that scale, is at most 0.5 is IT; the rest are provisionally IP.
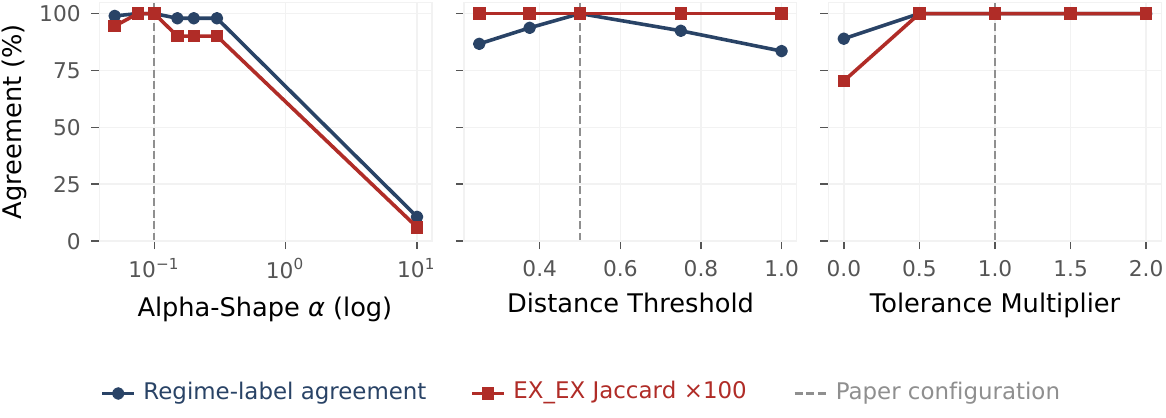
  3. Boundary override. A concave hull (alpha shape, α = 0.1) bounds the training support. Test points outside the hull and at least a tolerance ε from its boundary (0.049 in the wind plane, 0.021 in the wave plane) become EX; points just outside but within the tolerance stay IP.

Crossing the two labels gives nine joint regimes, with EX_EX (extrapolation on both axes) the worst case. A random split samples test points from the training envelope and leaves every extrapolation regime empty; the regime-aware partition populates all nine. The grid counts test simulations per cell (the same for every tower).

Regime partition in the wind and wave planes

FLOATBench regime partition in the wind (left) and wave (right) subspaces; the training domain (alpha-shape hull) is shaded.

Evaluation levels

E1 · Random split

A random partition matched in size to E2 (about 27/73), run on each tower. Same surrogates and training-set size as E2, so any difference reflects the partitioning alone.

E2 · Within tower

The regime-aware partition, run on each tower. Results per regime (EX_EX as worst-case extrapolation) and per section (section 1 base vs section 30 top).

E3 · Cross tower

Leave one tower out: train on two towers, test on the third (REF+OPT1 → OPT2, REF+OPT2 → OPT1, OPT1+OPT2 → REF), with the operating envelope fixed.

Surrogates. XGBoost, LightGBM, CatBoost, NeuralNetFastAI, NeuralNetTorch, ExtraTrees, RandomForest and TabM, trained through AutoGluon-Tabular 1.5.0 with the best and extreme presets under a 4-hour budget per run. Inputs: mean and std wind speed, Hs, Tp, and section height, radius and thickness; target: D1/3 (DEL format). This gives 82–96 models per tower for E1/E2 and 58–63 per fold for E3, plus seven standalone baselines (TabPFN, XGBoost, polynomial chaos, response surface, Gaussian process and others).

Metrics. Rel L² (relative L²-norm error) is the primary ranking metric; MRE (point-wise mean relative error) is the per-regime metric. Every leaderboard number is a bootstrap mean ± standard deviation over B = 2,000 resamples of whole operating conditions.

Leaderboard

Within-tower benchmark (E2): every surrogate of the AutoGluon best and extreme pools, scored by relative L² error on the damage equivalent load (Rel L² DEL, lower is better). Switch the regime to see how the ranking changes when only extrapolation points count (EX_EX = test points outside the training data in both wind and waves; see Terms used on this page). Click a row to see its error across the nine regime cells.

On the diagonal a model keeps its Global rank; below it, the model ranks better in this regime.

Error of the selected model in the nine cells; darker = worse.

Point estimates on the full test set. Condition-level bootstrap intervals are produced by scripts/leaderboard/. Rank changes are relative to the Global ranking of the same pool.

Accuracy vs cost

Error in

Size = model size on disk 0.1 MB 10 MB 1 GB
Colour = inference latency 1 → 1000 µs per row
Shape = model familylegend under the axis
Dashed line = Pareto frontnothing is both faster to train and more accurate

Lower = more accurate, left = faster to train (log scales). Hover a model for all its numbers; click it to select it in the table.

Results

E1 · Random split

Everything looks easy, the wrong models win

Under a random split, all top-10 surrogates appear strong: roughly 2–4% Rel L² DEL across towers, with overlapping confidence intervals between adjacent ranks. But the test set contains no hard regime: random validation leaves every extrapolation regime empty by construction. A condition-grouped random split is equally optimistic (0.0198 vs 0.0191 on REF), so the cause is absent extrapolation, not seed leakage.

A damage benchmark needs a regime-aware split, not a random one, to choose the right model.

E2 · Within tower

Different regimes pick different winners

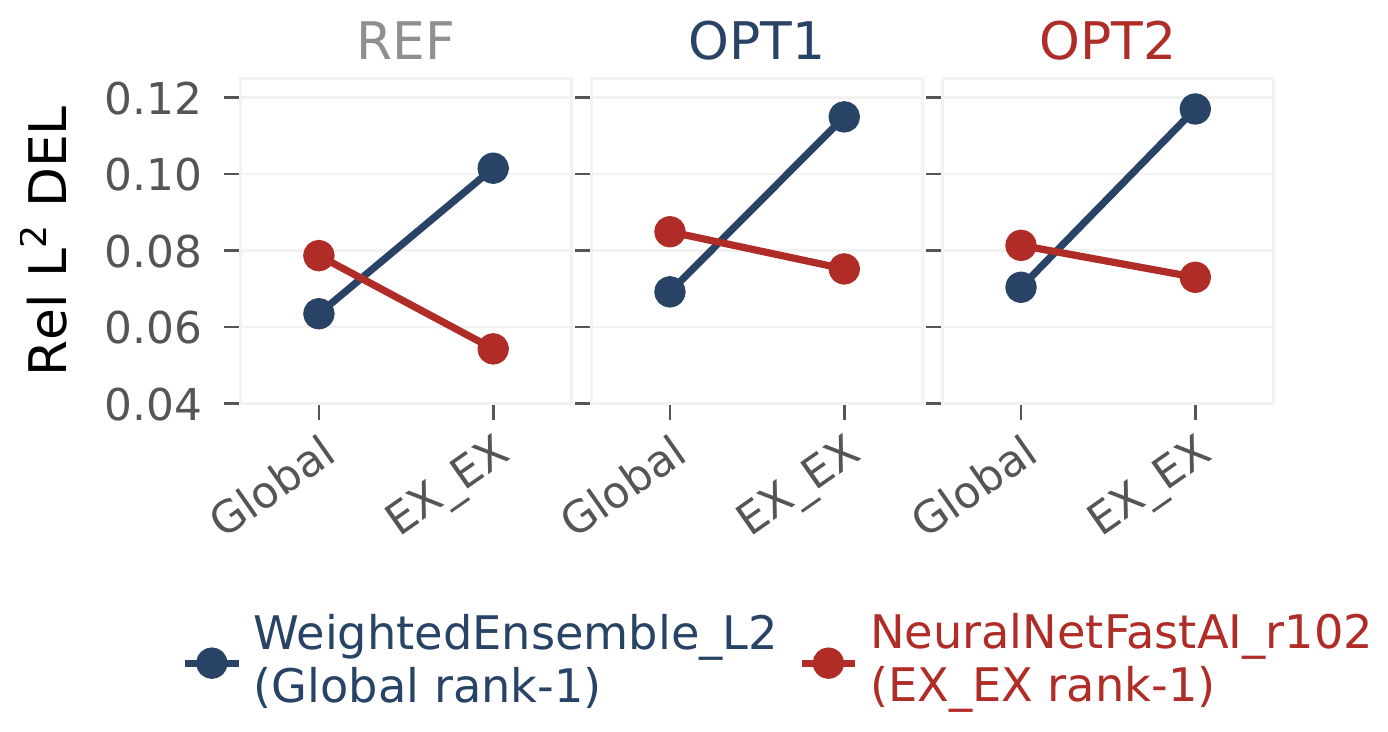
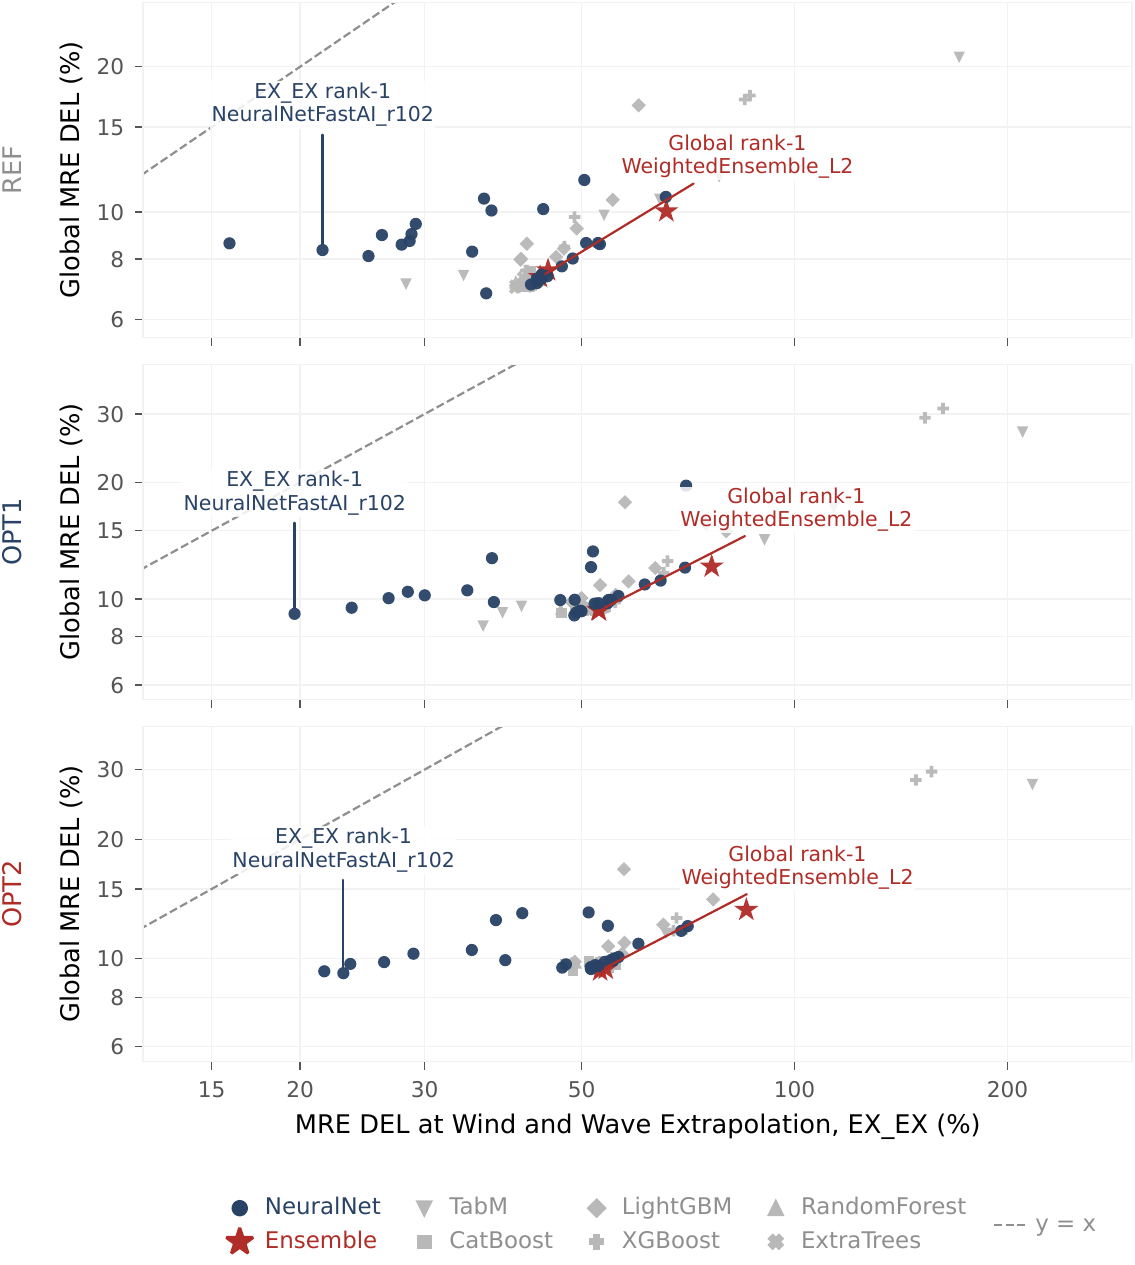
The Global winner loses at the wind-and-wave extrapolation regime. EX_EX is the deepest extrapolation cell and has the highest error on every tower. The Global rank-1 WeightedEnsemble_L2 drops to EX_EX ranks 23 / 11 / 11 (REF / OPT1 / OPT2), while the EX_EX rank-1 NeuralNetFastAI_r102_BAG_L1 sits at Global ranks 79 / 73 / 69.

Global and EX_EX Rel L2 DEL of the Global rank-1 and EX_EX rank-1 models

Rel L² DEL, Global vs EX_EX. The Global winner drops at EX_EX, where a low-ranked network wins.

Main results (E2): Rel L² DEL, Global / EX_EX

ModelREFOPT1OPT2
Ensemble†0.063 / 0.1010.069 / 0.1150.070 / 0.117
FastAI NN*0.079 / 0.0540.085 / 0.0750.081 / 0.073
TabPFN0.072 / 0.1040.072 / 0.0990.071 / 0.090
XGBoost0.078 / 0.1150.078 / 0.1500.079 / 0.153
PCE0.087 / 0.0740.108 / 0.1170.104 / 0.118
Resp. surface0.087 / 0.0730.143 / 0.1940.137 / 0.189
GP0.131 / 0.3070.147 / 0.3400.145 / 0.335

†Global and *EX_EX rank-1 of the AutoGluon pool; other rows are standalone baselines.

The crossover is robust and not an AutoML artifact. It holds for every partition setting that still leaves an extrapolation region, on all three towers, and after retraining the pool on two other training grids. TabPFN and tuned XGBoost do not beat the EX_EX winner. Selecting on validation leaves 1.5–1.9× the best available EX_EX error; the ensemble puts 86–88% of its weight on tree models, which under-predict beyond the training domain.

The crossover is a family effect. A tree-weighted ensemble wins globally and bagged networks win at EX_EX; the EX_EX top-10 is dominated by NeuralNet variants on all three towers, while TabM degrades most.

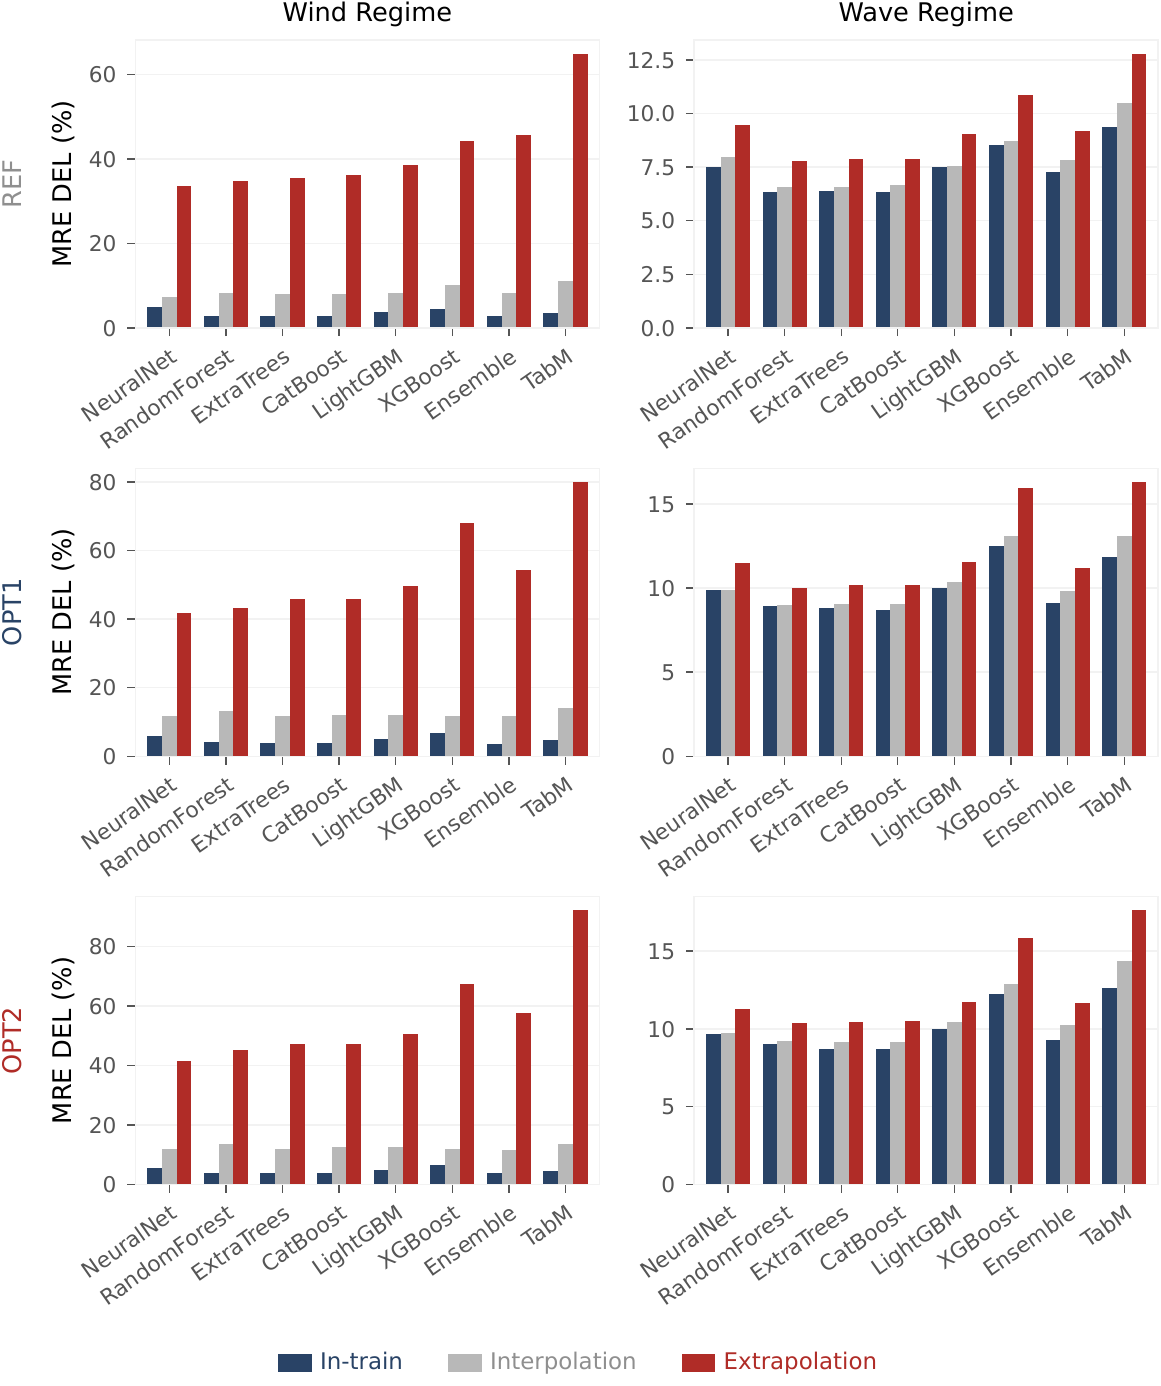
Wind drives the extrapolation. By model family, error grows 6–20× from In-train to Extrapolation on the wind axis, but only 1.1–1.4× on the wave axis.

Sections pick different winners. On REF no model wins both the base and the top; on OPT1/OPT2 the Global rank-1 keeps the base but loses section 30 to NeuralNetTorch_r22.

For damage prediction, the Global rank-1 does not remain best across regimes and sections: it loses at EX_EX and at the tower top.

E3 · Cross tower

The rank-1 fails again, on geometry and on sections

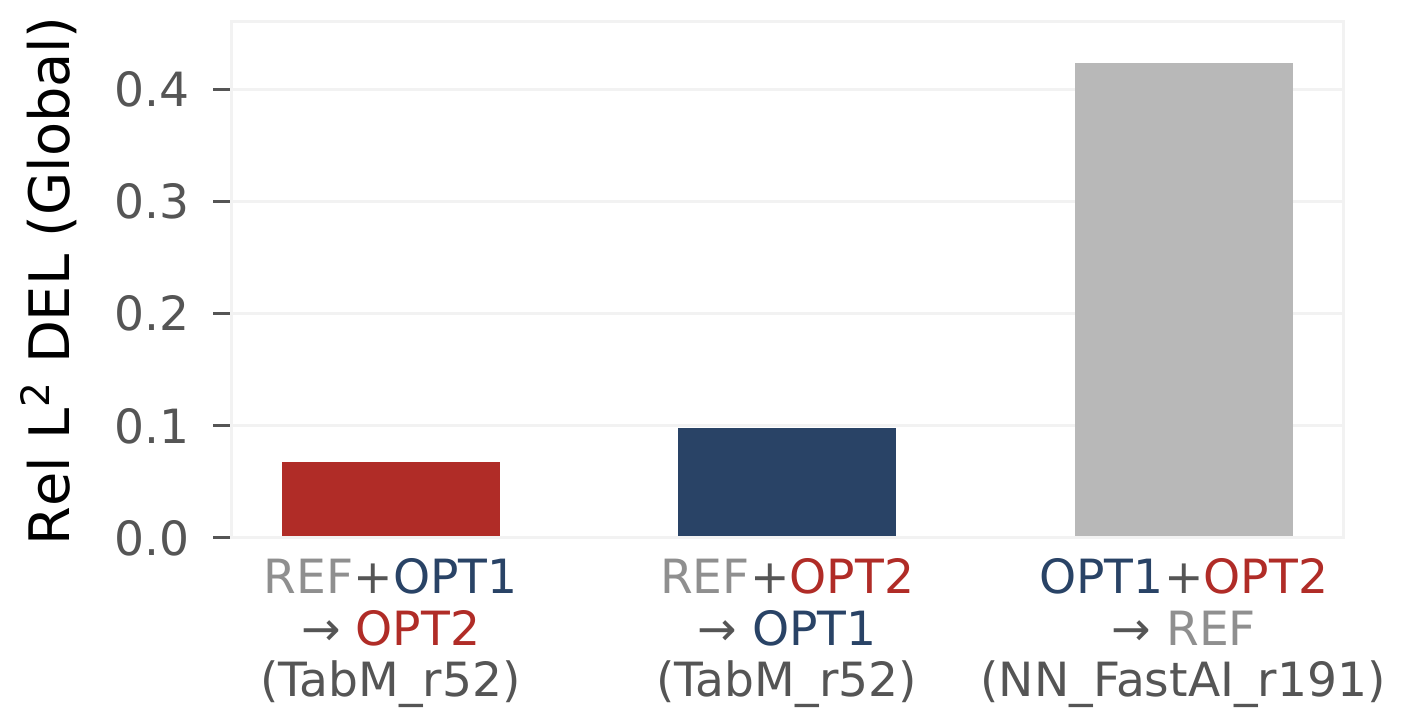
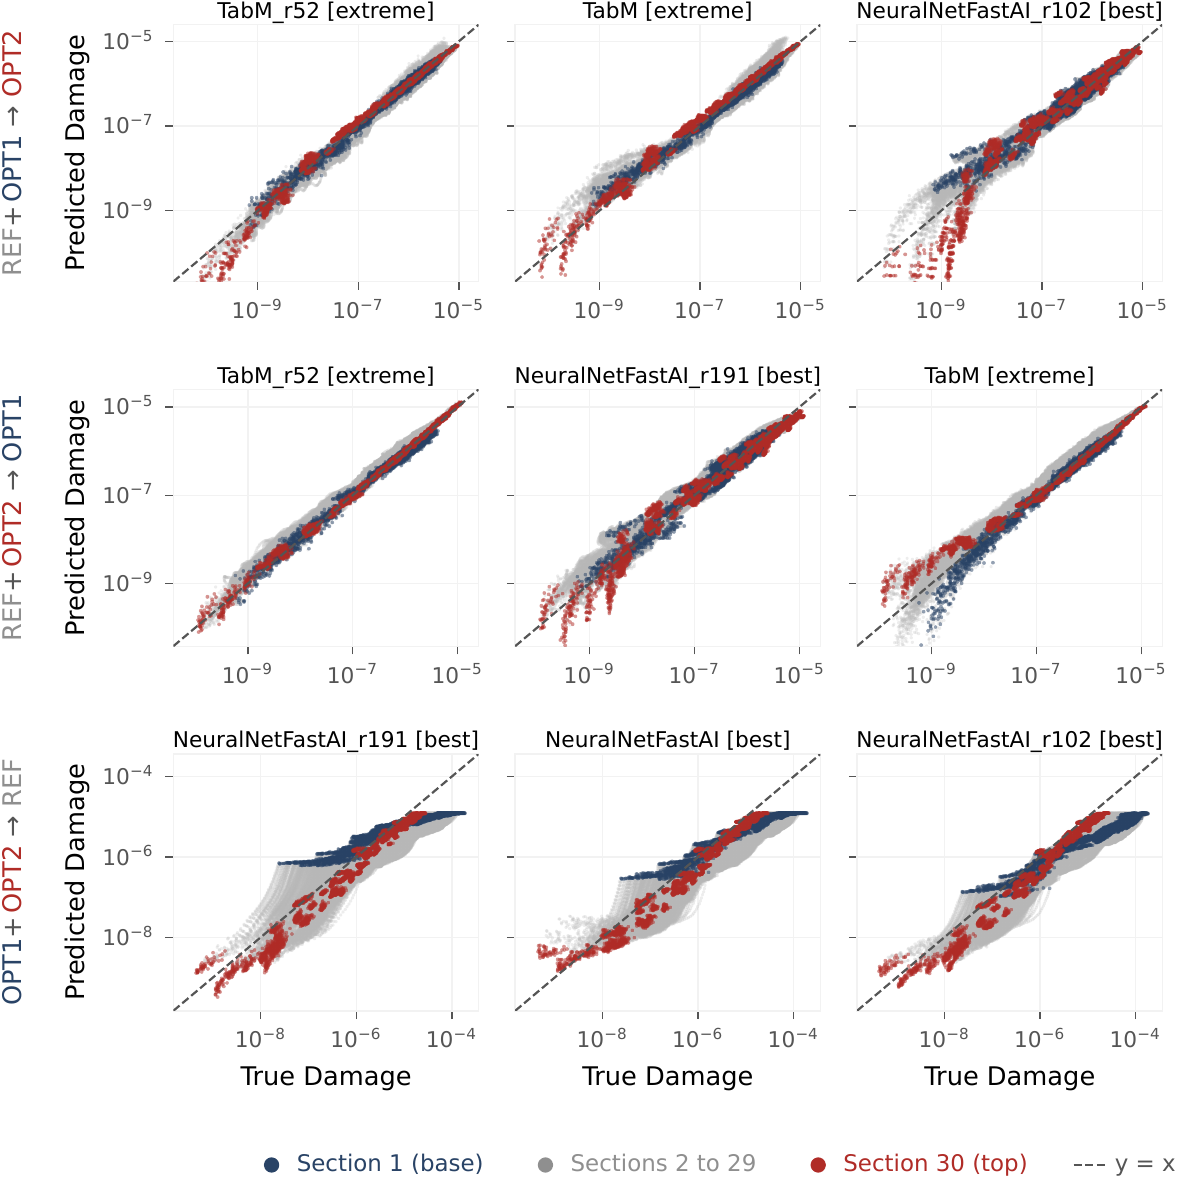
Transfer collapses on geometries far from training. Training on a set that includes REF generalises to the redesigned towers, with rank-1 Rel L² DEL of 0.067 (REF+OPT1 → OPT2) and 0.098 (REF+OPT2 → OPT1). Training without REF (OPT1+OPT2 → REF) reaches 0.423, a 4–6× increase: holding REF out under-predicts, consistent with its wider damage profile and most distinct geometry.

Sections pick different winners across folds. The section 1 winner is a NeuralNet variant on all three folds, while TabM_r52 wins section 30 on all three.

Rank-1 Rel L2 DEL per cross-tower fold

Rank-1 Rel L² DEL per fold (model name in parentheses).

Across towers, the Global rank-1 again does not remain best across geometry and sections.

More Results from the Paper

Figures from the appendix of the paper. Click a figure to open it at full size.

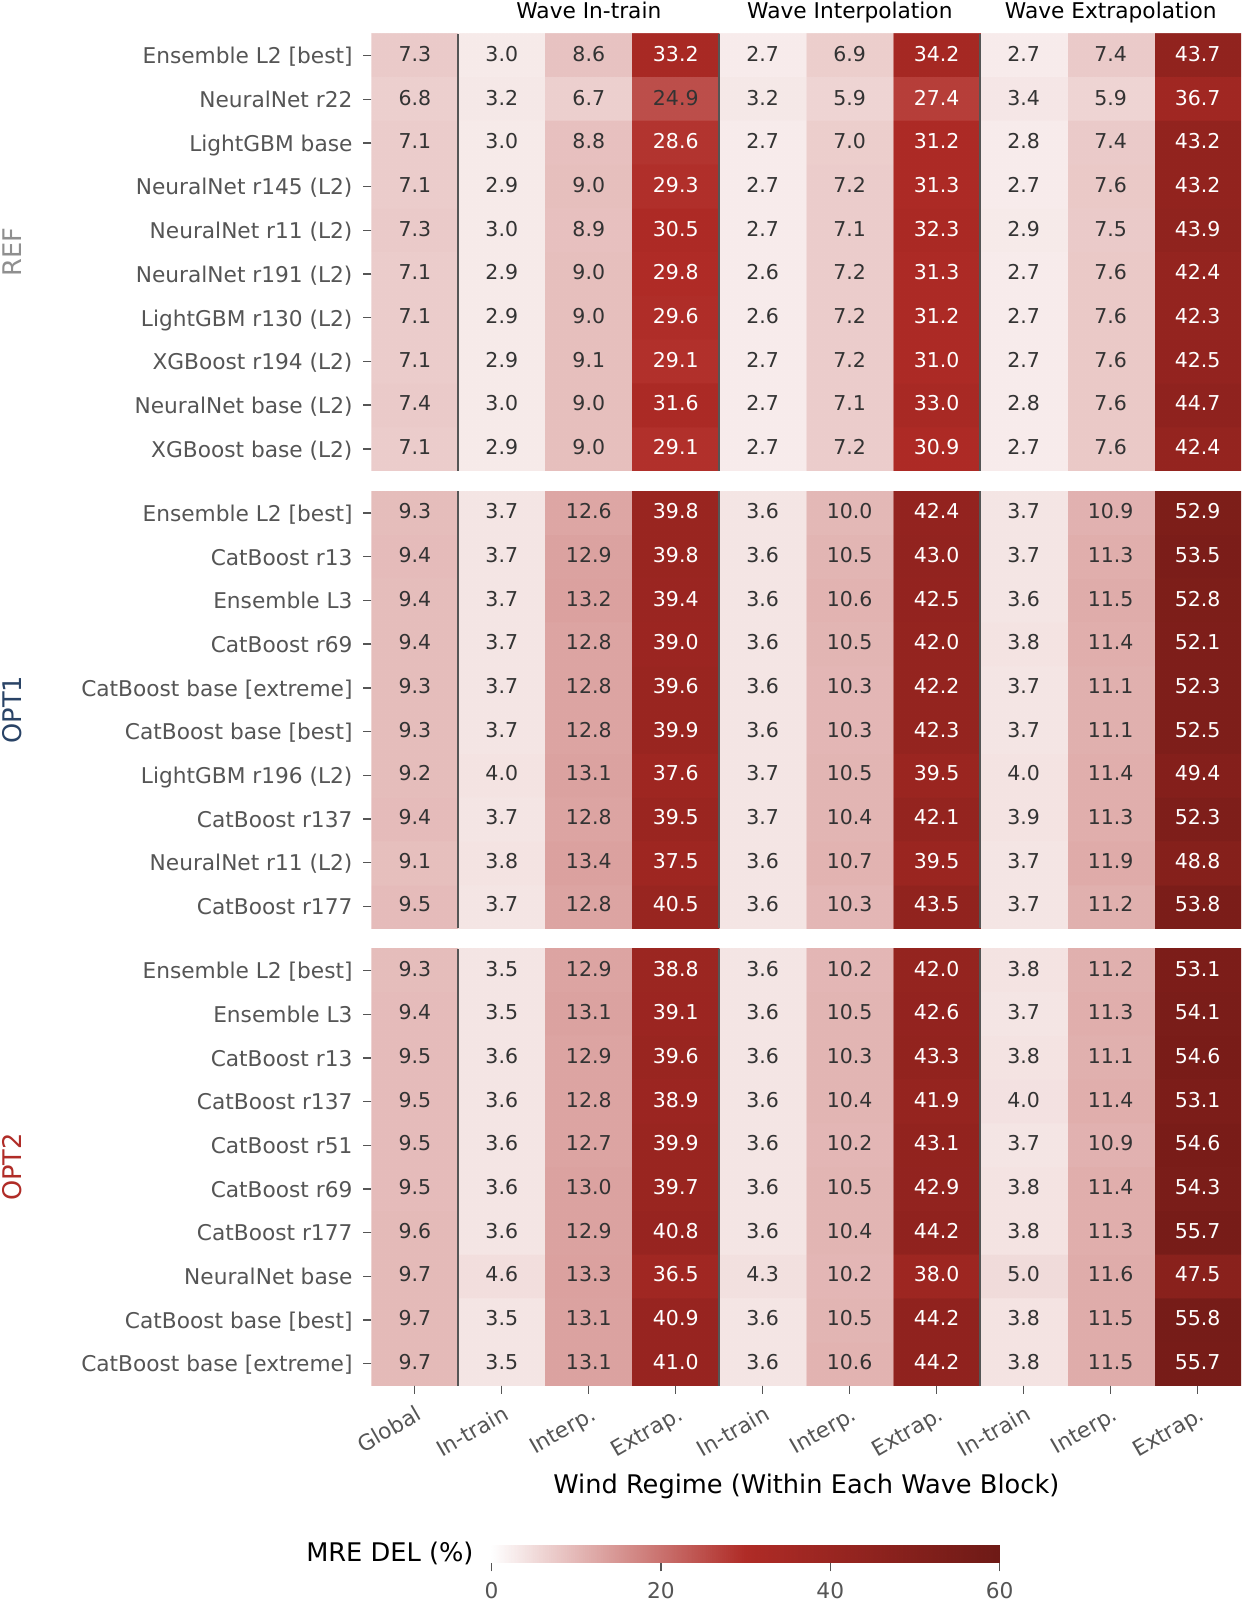
Error across the nine regimes (E2)

Heatmap of MRE DEL across the nine regimes

MRE DEL of the top-10 models per tower; EX_EX (rightmost) is the worst case.

Wind drives the extrapolation error (E2)

Family-aggregated error by wind and wave regime

Error by family and regime: wind extrapolation drives the error, waves stay flat.

Global vs EX_EX error per model (E2)

Scatter of Global vs EX_EX error per model

Below the diagonal = worse at EX_EX. NeuralNet stays closest; TabM degrades most.

Predicted vs true damage across towers (E3)

Predicted vs true damage scatter for E3

Top-3 models per fold; OPT1+OPT2 → REF under-predicts the held-out tower.

Stability of the regime labels

Sensitivity of regime labels to partition parameters

Labels stay stable for α in [0.05, 0.3] (agreement ≥ 97.9%).

Spacing of the training grid

Nearest-neighbour spacing, wind subspace
Nearest-neighbour spacing, wave subspace

Nearest-neighbour spacing of the training points; its mean sets the In-train threshold.

Scope and Future Work

Three geometries, one design family. The towers are the IEA-22 baseline and two fatigue-aware redesigns of it: the setting of design iteration, where a surrogate must follow the design as it changes. They are not near-duplicates: the first fore-aft frequency of REF lies close to the 3P excitation while the redesigns sit above it, and the base damage changes by a factor of about 40. E3 tests within-family transfer; cross-family generalisation (NREL 5 MW, DTU 10 MW, IEA-15) is left to future releases. The regime partition depends only on the wind/wave grid, so it carries over to other families.

Load case. The first release covers aligned wind–wave power production (DLC 1.2), the standard fatigue design load case of IEC 61400-3-2, which typically dominates lifetime tower fatigue. Misaligned, parked and idling cases involve different physics and new simulation campaigns.

Future work. Further tabular foundation models (TabICL, TabDPT), a time-series task on the ≈190 GB OpenFAST record (a 147-simulation audit subset is already released), other load cases and design families, and FEA/CFD meshes for multi-fidelity benchmarks.

Resources

 FLOATBench (code)

Evaluation harness, regime-aware splitter, bootstrap leaderboards and every paper analysis, all driven by --flagfile configs. Smoke test in ~10 min, full reproduction of E2 + E3 in ~48 GPU-hours.

 DeCoDELab/FLOATBench (dataset)

Train and test CSVs for the three towers with the regime labels, lifetime weights and section geometry. Released under CC-BY-4.0.

 Paper (arXiv 2605.25717)

Dataset construction, the regime-aware partition, the three protocol levels and the full benchmark results.

 FLOAT (design framework)

The fatigue-aware tower design framework that produced the OPT1 and OPT2 geometries of FLOATBench.

Citation

@misc{ribeiro2026floatbenchdatasetbenchmarkfloating,
      title={FLOATBench: A Dataset and Benchmark for Floating Offshore Wind Turbine Tower Fatigue},
      author={João Alves Ribeiro and Bruno Alves Ribeiro and Francisco Pimenta and Sérgio M. O. Tavares and Faez Ahmed},
      year={2026},
      eprint={2605.25717},
      archivePrefix={arXiv},
      primaryClass={cs.AI},
      url={https://arxiv.org/abs/2605.25717},
}

Acknowledgements

The high-fidelity simulations underlying FLOATBench were produced with OpenFAST on the IEA-22-280-RWT reference floating wind turbine. The tabular surrogate pipeline relies on AutoGluon. We thank these communities for keeping the underlying tools open.